This is Duty Room for Canada. We have a version for your country.

Duty Room
Data: 2026

Who owns the pour

BC's 10,572 Liquor Licences: Market Map

Liquor 13 min read

BC has 10,572 active liquor licences.1 That total covers every food primary, liquor primary, manufacturer, retail store, agent, and club licence in the province. It is the most complete snapshot of BC's licensed hospitality market that exists in structured form.

The licence register lists each licence with its holder, type, city, and address. What follows is the full picture of who holds licences in BC, where they operate, and how concentrated the market is.

Two licence types account for 75% of the market

Food Primary licences outnumber everything else. 6,089 of them, 57.6% of the total. These are restaurants, cafes, hotel dining rooms, and any establishment where the primary purpose is serving food and liquor accompanies it. Food Primary licensees must keep a reasonable variety of appetizers and main courses available whenever liquor is available.

Liquor Primary is the second tier: 1,837 licences, 17.4%. Bars, pubs, nightclubs, lounges, stadiums, concert halls. The establishments where drinking is the point, not an accompaniment.

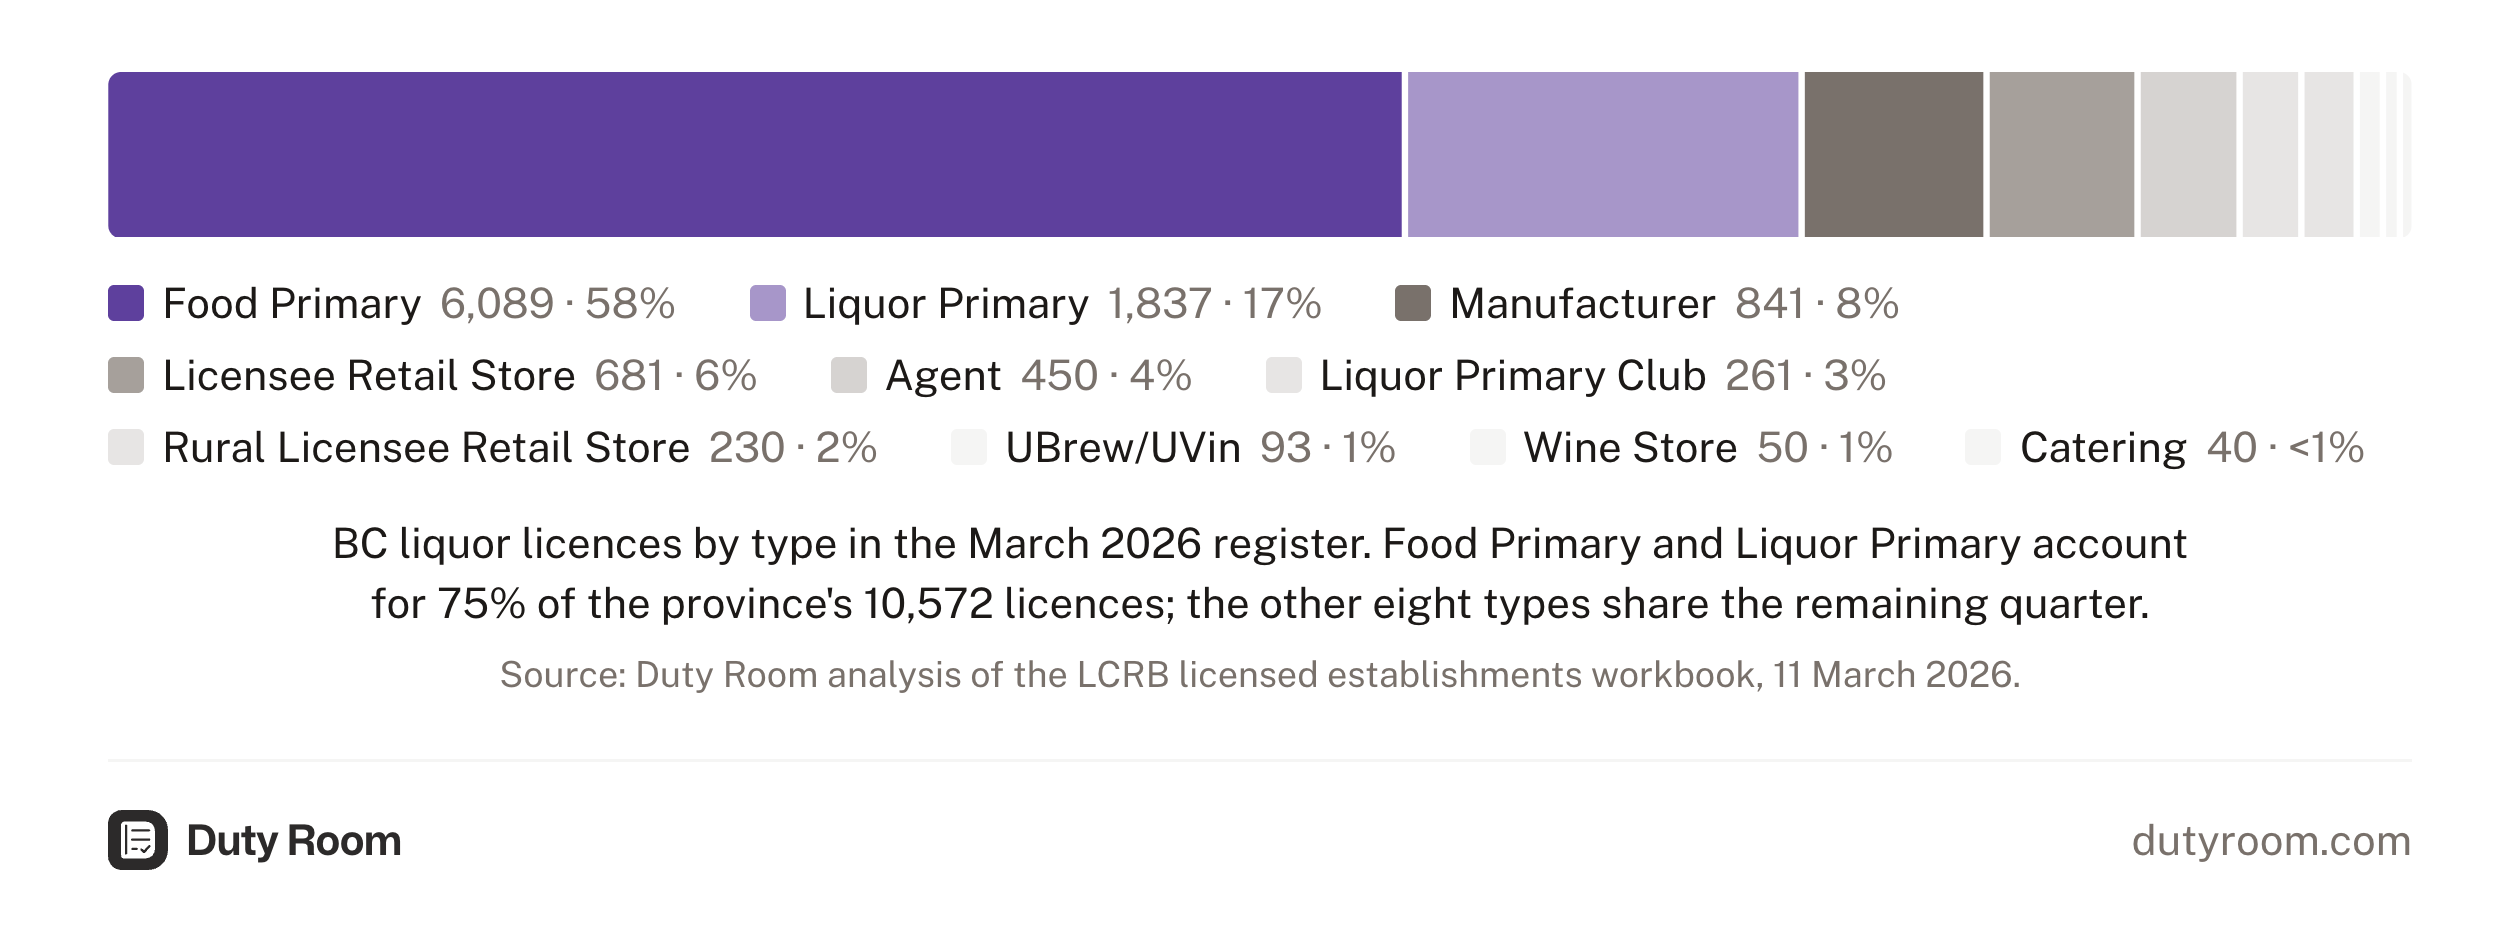
A single bar splitting BC's 10,572 liquor licences by type: Food Primary 6,089 (57.6%), Liquor Primary 1,837 (17.4%), Manufacturer 841 (8.0%), Licensee Retail Store 681 (6.4%), Agent 450 (4.3%), Liquor Primary Club 261 (2.5%), Rural Licensee Retail Store 230 (2.2%), UBrew/UVin 93 (0.9%), Wine Store 50 (0.5%), and Catering 40 (0.4%).
Food Primary 6,089 · 58% Liquor Primary 1,837 · 17% Manufacturer 841 · 8% Licensee Retail Store 681 · 6% Agent 450 · 4% Liquor Primary Club 261 · 3% Rural Licensee Retail Store 230 · 2% UBrew/UVin 93 · 1% Wine Store 50 · 1% Catering 40 · <1%
BC liquor licences by type in the March 2026 register. Food Primary and Liquor Primary account for 75% of the province's 10,572 licences; the other eight types share the remaining quarter.Source: Duty Room analysis of the LCRB licensed establishments workbook, 11 March 2026.
Licence type Count Share
Food Primary 6,089 57.6%
Liquor Primary 1,837 17.4%
Manufacturer 841 8.0%
Licensee Retail Store 681 6.4%
Agent 450 4.3%
Liquor Primary Club 261 2.5%
Rural Licensee Retail Store 230 2.2%
UBrew/UVin 93 0.9%
Wine Store 50 0.5%
Catering 40 0.4%

The combined Food Primary and Liquor Primary count is 7,926. That's the core hospitality market for compliance purposes. Add clubs and catering, and the broader hospitality total reaches 8,227.

The remaining 2,345 licences span manufacturers (841 breweries, wineries, and distilleries), licensee retail stores (681 private liquor stores), agents (450), rural retail stores (230), UBrew/UVin operations (93), and wine stores (50). The manufacturer count is the product of a decade of craft growth: BC counted 112 breweries in mid-2015 and had just four craft distilleries in 2010; the March 2026 register lists 841 manufacturer licences, clustered in the Okanagan and across Metro Vancouver.

Food Primary and Liquor Primary are different operations

The split between FP and LP isn't just a licensing label. These are structurally different businesses with different compliance profiles.

Food Primary establishments overwhelmingly close at midnight. 55.9% of FP licences have a Friday closing time of 12:00 AM.2 Only 10.8% are licensed to close at 2:00 AM or later on weekends.

Liquor Primary is a different world. The most common Friday closing time is 1:00 AM (39.5%), and 38.1% of LP establishments are licensed to close at 2:00 AM or later on weekends. That's 3.5 times the late-night rate of FP.

LP also holds a disproportionate share of total capacity. Despite accounting for 17.4% of licences, Liquor Primary holds 51.7% of the province's total licensed person capacity (1,100,528 out of 2,130,170).3 That number is skewed by stadiums and arenas: BC Place alone accounts for 97,150 capacity. But it also reflects the fact that LP venues are just bigger, on average, than FP venues. The typical (median) FP establishment holds 86 people; the typical LP establishment, 150.

Late nights, larger crowds, and alcohol as the primary activity: that profile is what most people picture when they think of liquor enforcement. The waiver record is mostly restaurants, though. Two-thirds of its cases sit on Food Primary licences, and the contravention that drives it, selling to a minor, lands overwhelmingly on restaurants rather than bars.4

Where the licences are

Metro Vancouver holds 4,116 licences, 38.9% of the provincial total.5 Victoria and the Capital Regional District hold another 741, at 7.0%. The remaining 54.1% is spread across the rest of BC.

A compliance platform that only works for Metro Vancouver covers fewer than four in ten licences. The majority of BC's licensed premises operate in regional cities, resort towns, highway corridors, and rural communities.

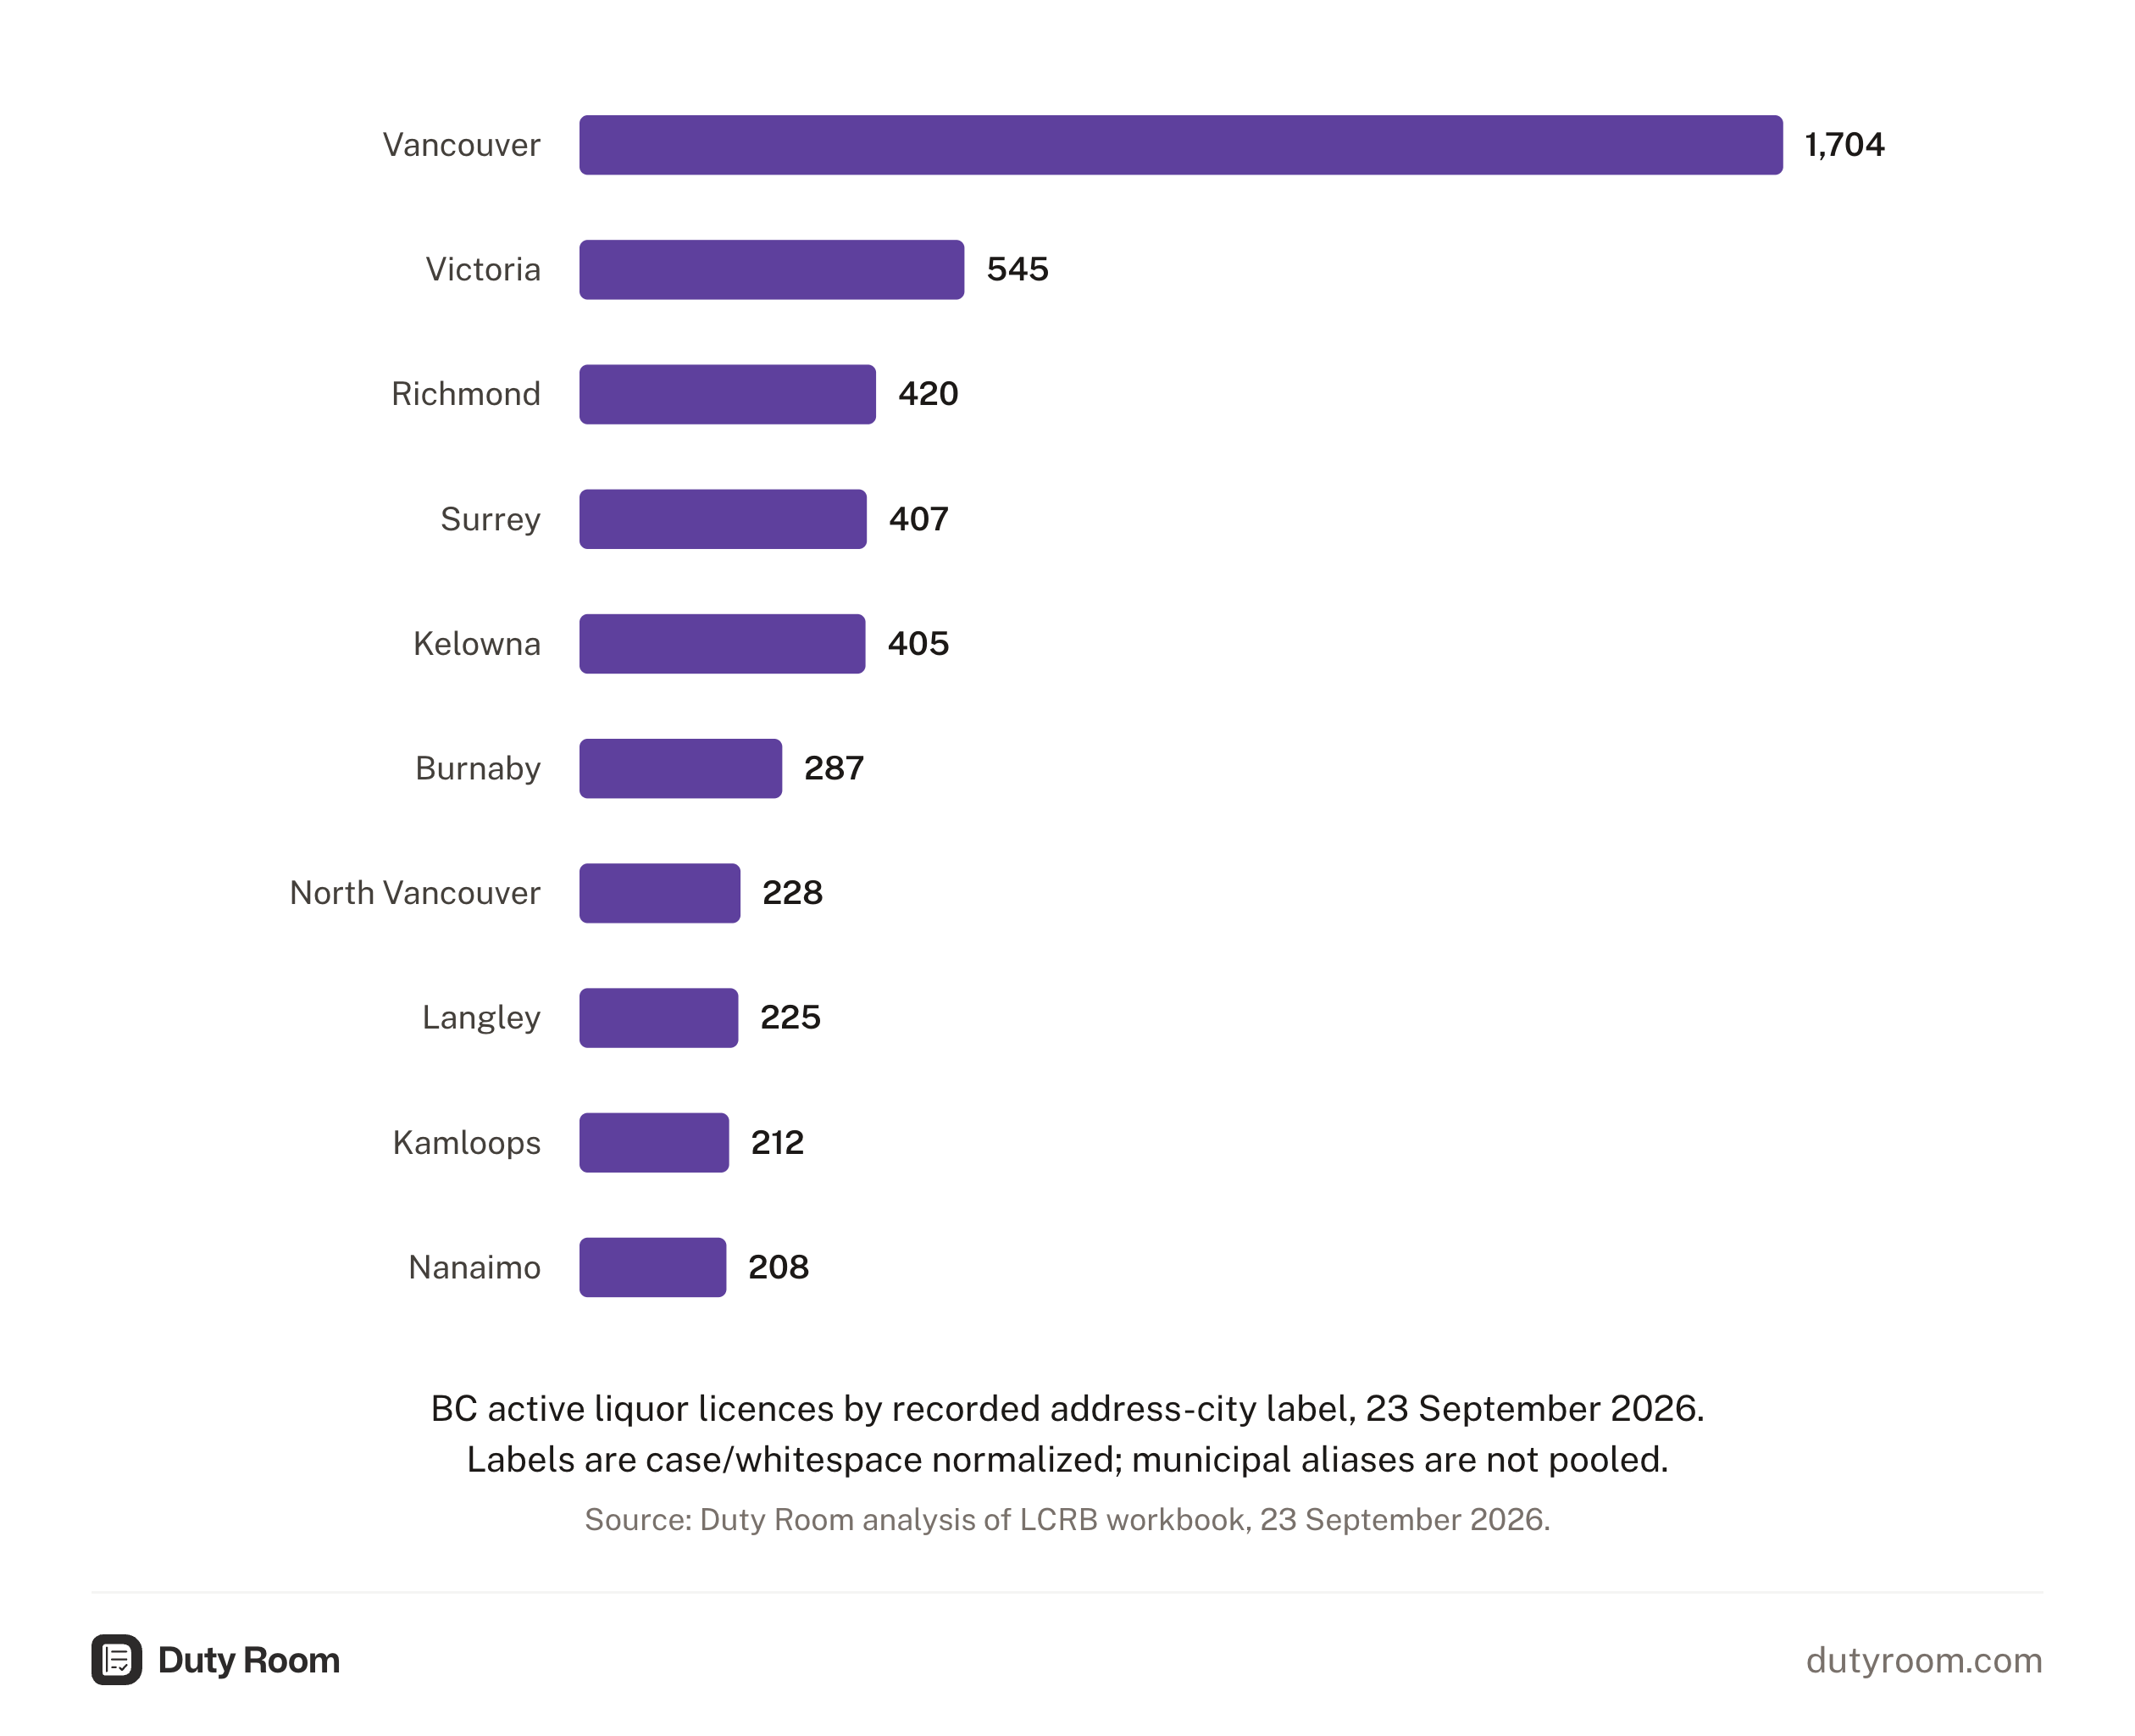
Ranked horizontal bars of active liquor licences by city: Vancouver 1,713, Victoria 541, Richmond 418, Surrey 417, Kelowna 406, Burnaby 279, North Vancouver 232, Langley 225, Kamloops 213, and Nanaimo 204.
BC's ten largest municipal liquor-licence markets in the March 2026 LCRB register. Vancouver's 1,713 licences make it 3.2 times the size of second-place Victoria.Source: Duty Room analysis of the LCRB licensed establishments workbook, 11 March 2026.
City Total FP LP Manufacturer Retail Other
Vancouver 1,713 1,272 273 56 59 53
Victoria 541 372 106 20 21 22
Richmond 418 324 56 13 16 9
Surrey 417 289 54 15 47 12
Kelowna 406 228 80 53 29 16
Burnaby 279 227 27 4 12 9
North Vancouver 232 164 19 21 14 14
Langley 225 154 20 27 19 5
Kamloops 213 111 52 14 24 12
Nanaimo 204 111 52 8 21 12

Vancouver's 1,713 licences make it the largest single market by a wide margin. Victoria is second at 541. The drop from first to second is a 3.2x gap.

Kelowna at 406 punches above its population weight, driven by its manufacturer count: 53 wineries, breweries, and distilleries. In the Okanagan more broadly, Oliver (96 licences, 66 of them manufacturers), Penticton (162, with 53 manufacturers), and Summerland (47, with 28 manufacturers) form a winery corridor where manufacturers outnumber restaurants.

The geographic pattern also differs by licence type. Food Primary clusters heavily in Metro Vancouver: roughly 49% of all FP licences are in the Metro region. Liquor Primary is more geographically dispersed, with only about 30% in Metro Vancouver. LP follows the resort and destination pattern: Whistler (39 LP licences from 136 total), Kamloops (52 LP from 213), Nanaimo (52 from 204), Cranbrook (23 from 70). These are towns where bars, pubs, and entertainment venues serve both locals and visitors.

73 operators run 5 or more licences

The LCRB licence register names 8,622 distinct licensee entities across the 10,572 licences. Most operators hold a single licence. But 73 entities hold 5 or more, controlling a combined 652 licences, about 6.2% of the total.6

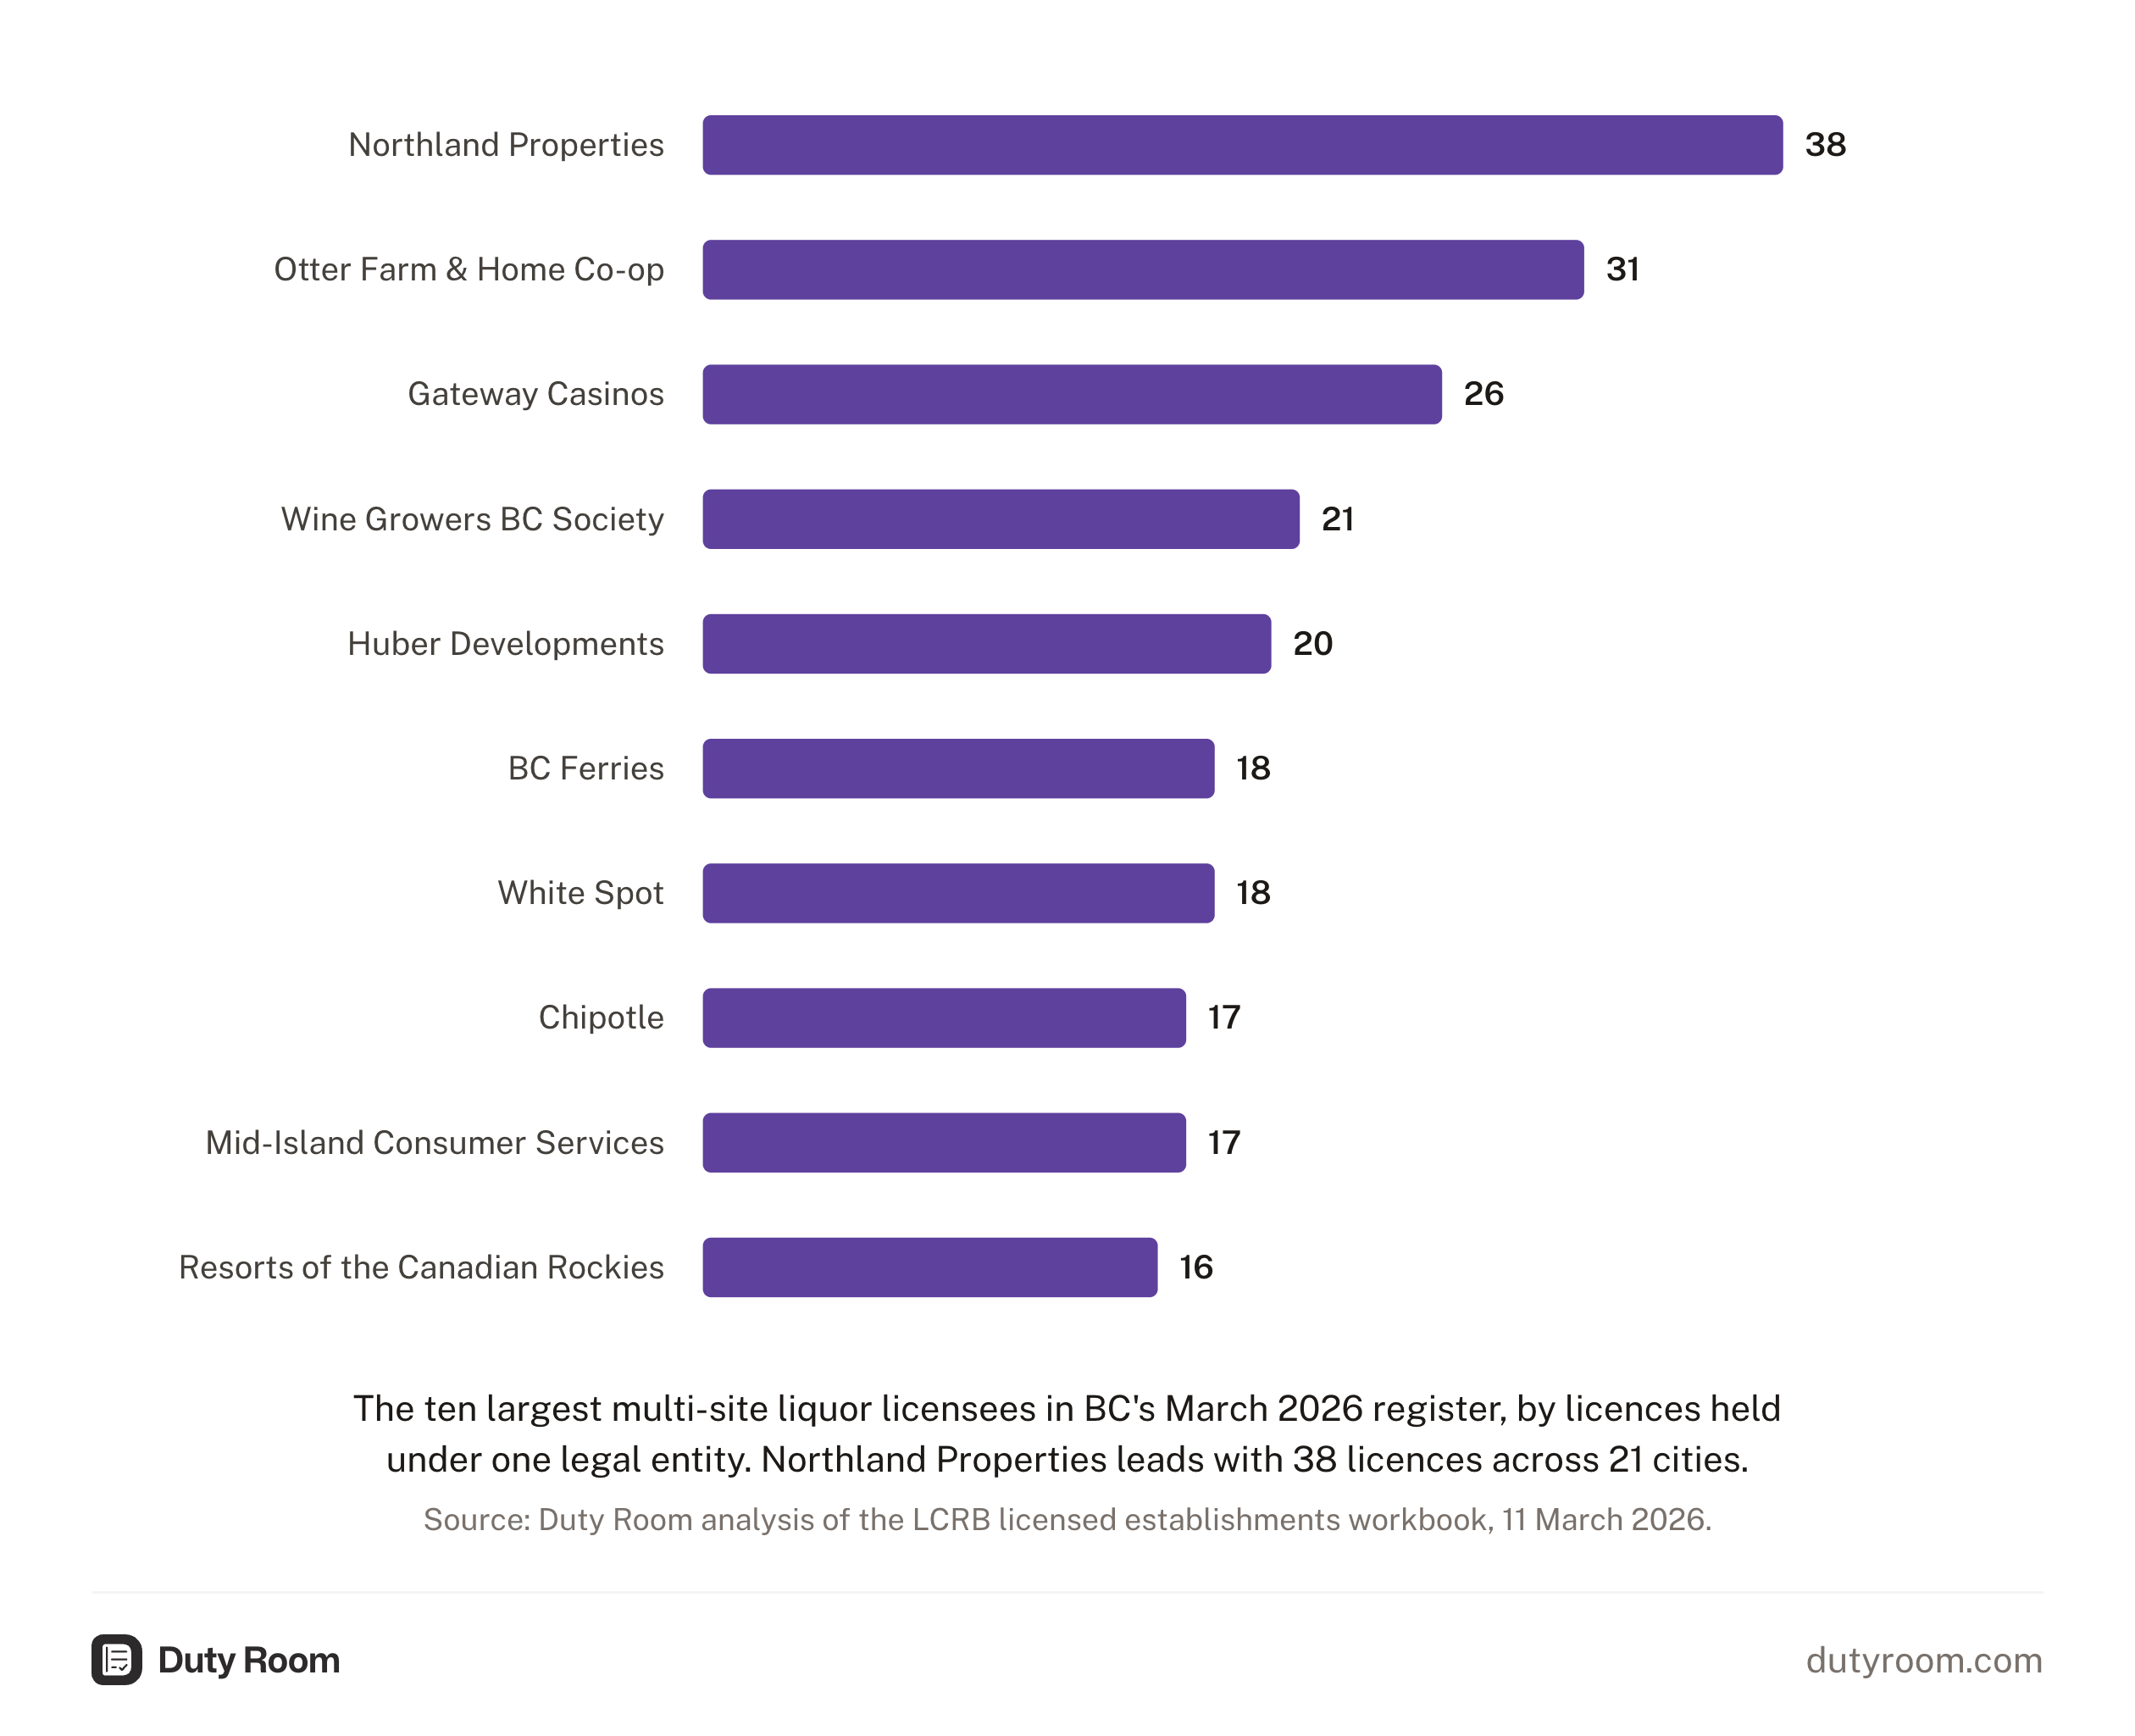
Ranked horizontal bars of licences held by BC's largest multi-site operators: Northland Properties 38, Otter Farm & Home Co-op 31, Gateway Casinos 26, Wine Growers BC Society 21, Huber Developments 20, BC Ferries 18, White Spot 18, Chipotle 17, Mid-Island Consumer Services 17, and Resorts of the Canadian Rockies 16.
The ten largest multi-site liquor licensees in BC's March 2026 register, by licences held under one legal entity. Northland Properties leads with 38 licences across 21 cities.Source: Duty Room analysis of the LCRB licensed establishments workbook, 11 March 2026.
Operator Licences Types Primary city Cities
Northland Properties 38 FP:25, LP:7, Retail:6 Vancouver 21
Otter Farm & Home Co-op 31 Retail:29, LP:1, FP:1 Abbotsford 16
Gateway Casinos 26 LP:22, FP:4 Langley 10
Wine Growers BC Society 21 Wine Store:21 Surrey 17
Huber Developments 20 FP:10, LP:7, Retail:3 Cranbrook 10
BC Ferries 18 FP:18 Delta 10
White Spot 18 FP:18 Burnaby 10
Chipotle 17 FP:17 Surrey 13
Mid-Island Consumer Services 17 Retail:17 Nanaimo 9
Resorts of the Canadian Rockies 16 FP:9, LP:6, Rural:1 Fernie 4

Northland Properties tops the list at 38 licences across 21 cities. Their portfolio is a mix of Food Primary (25, covering their Denny's and Sandman brands), Liquor Primary (7, including hotels with bar operations), and Licensee Retail Stores (6). They operate from Vancouver to Prince George to Fort Nelson.

Otter Farm & Home Co-op is second at 31, but the profile is entirely different: 29 of their 31 licences are licensee retail stores. They're a retail co-operative, not a hospitality operator.

Gateway Casinos at 26 licences is overwhelmingly LP (22 of 26). Casinos hold liquor primary licences for their gaming floors and bars. They operate across 10 cities, from Langley to Kamloops to Prince George. Universities (UBC at 14, SFU at 7) and municipalities (City of Vancouver at 14, City of Burnaby at 9, City of Kelowna at 6) also appear as multi-site licensees.

The resort operators stand out. Resorts of the Canadian Rockies (16 licences across Fernie and 3 other communities), Canadian Mountain Holidays (8 licences in 6 backcountry locations), Big White Ski Resort (6), Silver Star (6), Panorama Mountain Village (7), and two Whistler entities (Blackcomb Skiing at 5, Canadian Resort Hotels at 5). Ski resorts need licences for every lodge, restaurant, bar, and retail outlet on the mountain.

A caveat on these numbers. Franchise structures often use a separate corporation for each location. Joseph Richard Group, which operates roughly 20 to 25 establishments across Metro Vancouver, doesn't appear in the top 73 because each location is held by a different legal entity. The 73 operators with 5 or more licences undercount the true chain presence in BC.

Multi-site operators and enforcement exposure

Operating multiple sites multiplies enforcement risk. In the March 2026 waiver snapshot, multi-site operators appeared in the enforcement record at 3.5 times the all-licensee background rate.7

The mechanism is arithmetic rather than worse operations at chains: an operator with 38 licences runs 38 separate chances for a single server on a single shift to fail a Minors as Agents test. Every one of those failures starts at $7,000 or a 7-day suspension. In the 2026 waiver data, Northland picked up $14,000 across 2 locations. White Spot: $7,000. Moxie's: $7,000. GolfBC: $8,000.

Every one of those chains was caught selling to a minor. The only other charge in the group was a single untrained server penalty, bundled into GolfBC's total. Consistent ID-check culture across dozens of locations with hundreds of staff is a systems problem, and a policy that exists at head office but can't be produced at the premises level isn't a defence. The BCLCRB hearing decisions are consistent: the systems have to be working at the premises involved, and the records proving it have to come out of that site on the day an inspector asks.

The fragmented middle

The 73 multi-site operators hold 6.2% of all licences. That means 93.8% of licences are held by operators with four or fewer. BC's licensed hospitality market is overwhelmingly fragmented. 87% of licensees hold a single licence.

This fragmentation shapes the compliance challenge. A single-site FP operator in Kamloops and Northland Properties face the same regulations, the same penalty schedule, and the same MAP teams. But Northland has a head office compliance function. The single-site operator has whatever training system they've built themselves, or haven't.

The LCRB publishes the licence register. It publishes the penalty schedule. It publishes waiver reports. What it doesn't publish is a toolkit for the single-site operator who accounts for the vast majority of BC's licensed premises. The data is there. The synthesis isn't.

Licence density tells you where the market concentrates

Some cities punch above their weight relative to population. Others fall below it.

Whistler has a permanent population around 13,000 and 136 liquor licences. Its total licensed capacity is 205,402, a capacity-to-population ratio of roughly 15 to 1. Most of that sits in two venues: Merlins at Blackcomb Mountain (91,320) and Dusty's at Alta Lake (72,168). Those are ski-resort LP operations with event-scale capacity.

Oliver, a town of about 5,000 in the southern Okanagan, holds 96 licences. 66 of those are manufacturers. Oliver is a wine town, and its licence count reflects the density of wineries in the area, not a bar-and-restaurant scene.

At the other end, Surrey has 417 licences for a population above 700,000. That's roughly one licence per 1,700 residents. Vancouver, at 1,713 licences for about 740,000 people, sits at one per 430. The ratio reflects density, entertainment culture, and tourism.

The licence-density data matters for two reasons. For operators, it tells you how many competitors share your market. For compliance, it is the denominator under every enforcement rate: the enforcement heat map works from this same register, rating MAP enforcement per 100 licences to show where the LCRB's attention concentrates.

What the licence register doesn't tell you

The LCRB licence register is the best available data for BC's licensed hospitality market. It's also incomplete.

It doesn't include enforcement history. You can't look up whether a licensee has prior contraventions. Ontario's AGCO at least publishes quarterly aggregate enforcement summaries; the LCRB publishes no equivalent.

It doesn't track actual operating status beyond "active licence." An establishment with an active licence might be closed for renovations, seasonal, or operating under reduced hours. The licence register reflects licensing, not operations.

Franchise affiliations are hidden. Each location files under its own corporate name. Without manual research, you can't reconstruct which establishments belong to the same franchise system. The 8,622 "unique" licensee names overstate the true number of independent operators.

The LCRB doesn't publish aggregate inspection counts, enforcement pipeline data, or annual enforcement statistics. Unlike Ontario's AGCO, which publishes quarterly enforcement reports, the LCRB's enforcement data comes in fragments: individual waiver reports, individual hearing decisions on CanLII, and the licence register itself. Assembling a complete picture requires cross-referencing multiple sources.

That assembly is what this report and its companions attempt. The enforcement heat map maps where enforcement actions concentrate. The minors enforcement report analyses the dominant enforcement pattern. This report maps who operates where. Together, they form the closest thing to a complete picture of BC's licensed hospitality market and the enforcement system that regulates it.


  1. LCRB licence register, published 11 March 2026. 10,572 active licences across 10 licence types. Downloaded from gov.bc.ca. The branch refreshes the published workbook on a rolling basis, so the live register will differ from this snapshot.

  2. Duty Room analysis of the LCRB Hours of Service sheet (8,279 rows; 4,999 Food Primary and 1,664 Liquor Primary licences with filed hours). Closing-time shares are of licences with hours on file, and hours are licensed maximums rather than actual operating hours.

  3. Duty Room analysis of service-area records in the LCRB licence register (19,563 entries across 8,548 distinct establishments). Total licensed capacity: 2,130,170. Per-type medians computed from the same records: Food Primary 86 (6,054 establishments with capacity data), Liquor Primary 150 (1,823).

  4. Duty Room analysis of the LCRB 2026 Waiver Summary Report as posted in March 2026, with licence types matched to the 11 March 2026 register: Food Primary accounts for 138 of the 206 distinct liquor waiver cases (67%) against 32 for Liquor Primary, and 115 of Food Primary's 169 contravention rows are minors-related against 14 for Liquor Primary. The July 2026 rolling file shows the same pattern (119 Food Primary cases, 83 minors-related rows against Liquor Primary's 14). These are volume shares, and Food Primary is also the largest licence class (57.6% of licences); they are not a per-licence rate ranking. The report covers waived penalties only, not hearing outcomes.

  5. Duty Room analysis of the LCRB licence register (11 March 2026), after normalising 703 raw city entries to 409 distinct communities. Metro Vancouver defined as City of Vancouver, Burnaby, Richmond, Surrey, Delta, Coquitlam, Port Coquitlam, Port Moody, Langley, Maple Ridge, Pitt Meadows, North Vancouver, West Vancouver, and New Westminster.

  6. Duty Room analysis of the LCRB licence register (11 March 2026). 73 operators with 5 or more licences, holding a combined 652 licences (6.2% of total), per the March 2026 register snapshot recount (see the multi-domain offenders report's pinned basis). Operator names as recorded in the register; franchise structures using per-location corporations are not consolidated.

  7. Duty Room analysis of the LCRB 2026 Waiver Summary Report (254 waivers, February 2023 to November 2025), cross-referenced against the active licence register. The report is cited as posted in March 2026; the branch has since replaced it with a rolling file.

This report is based on published enforcement data, sources available at publication, and original analysis. It is for general information only and doesn't constitute legal advice.

Good intentions won't save your licence. Records will.

55% of accepted LCRB penalty waivers were for liquor sales to minors. The first offer is $7,000 or 7 days. Duty Room keeps the records due diligence stands on.

Stay informed

Get notified when we publish new reports and analysis.