Service-area sums, with limits
BC Licensed Capacity: Three 2026 Snapshots
The LCRB's 23 September 2026 workbook records 2,198,008 summed service-area capacity across 19,864 rows and 8,582 licence IDs. That is 67,838 more than the March workbook, an increase of 3.2% in the recorded sum.
This is not a count of seats occupied or a province-wide simultaneous occupancy limit. A licence can have several service areas with separate conditions. Adding their recorded capacities does not establish that they can all operate at those limits at once.
Three snapshots on one basis
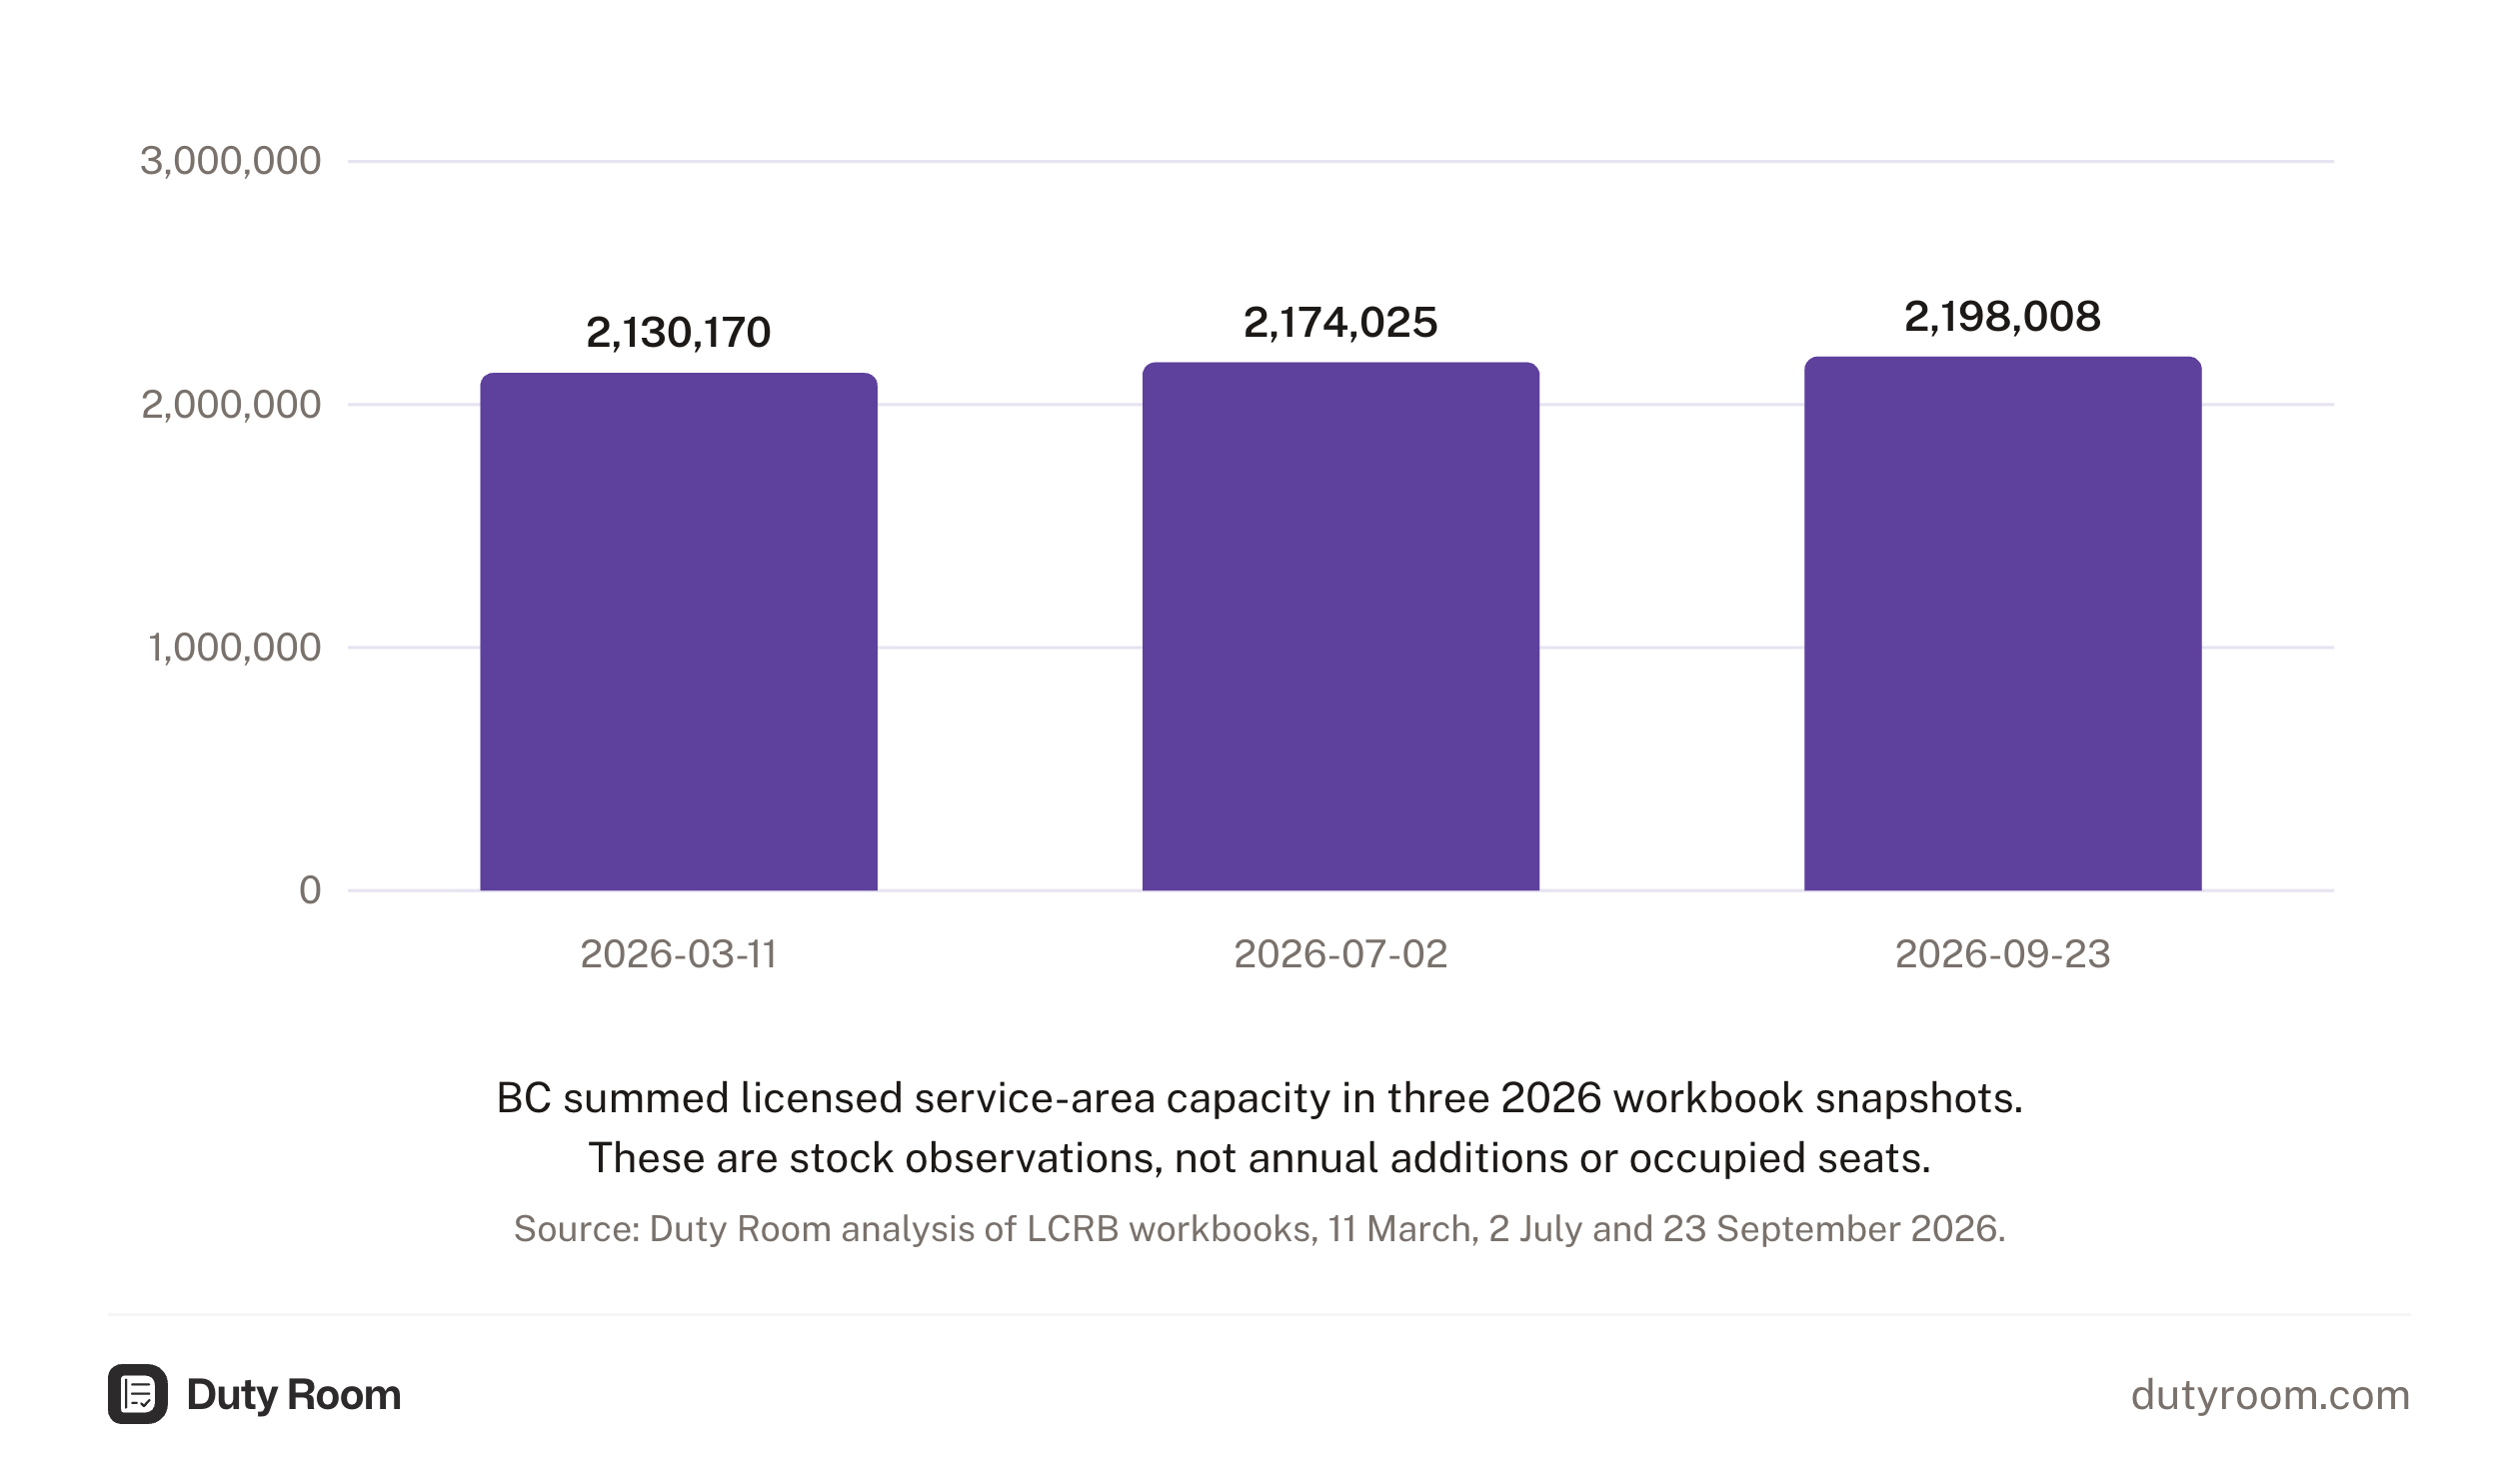
| Workbook date | Summed capacity |
|---|---|
| 2026-03-11 | 2,130,170 |
| 2026-07-02 | 2,174,025 |
| 2026-09-23 | 2,198,008 |
| Workbook date | Active licences | Service-area rows | Licence IDs with service areas | Summed capacity |
|---|---|---|---|---|
| 2026-03-11 | 10,572 | 19,563 | 8,548 | 2,130,170 |
| 2026-07-02 | 10,476 | 19,574 | 8,508 | 2,174,025 |
| 2026-09-23 | 10,562 | 19,864 | 8,582 | 2,198,008 |
The July workbook was generated on 2 July and archived on 10 July. All three workbooks are rebuilt with the same header-based extraction. Each has 31 service-area rows with blank capacity; those blanks contribute nothing to the sum but remain missing observations. July also contains one 52-capacity service-area row whose licence is absent from that workbook's active register. It remains in the service-area series and is flagged in the source data. March and September have no such unmatched IDs.
These are different stock snapshots. The differences can reflect licence additions, removals, amendments or source revisions. They do not measure construction, attendance or net business openings.
Where the recorded capacity sits
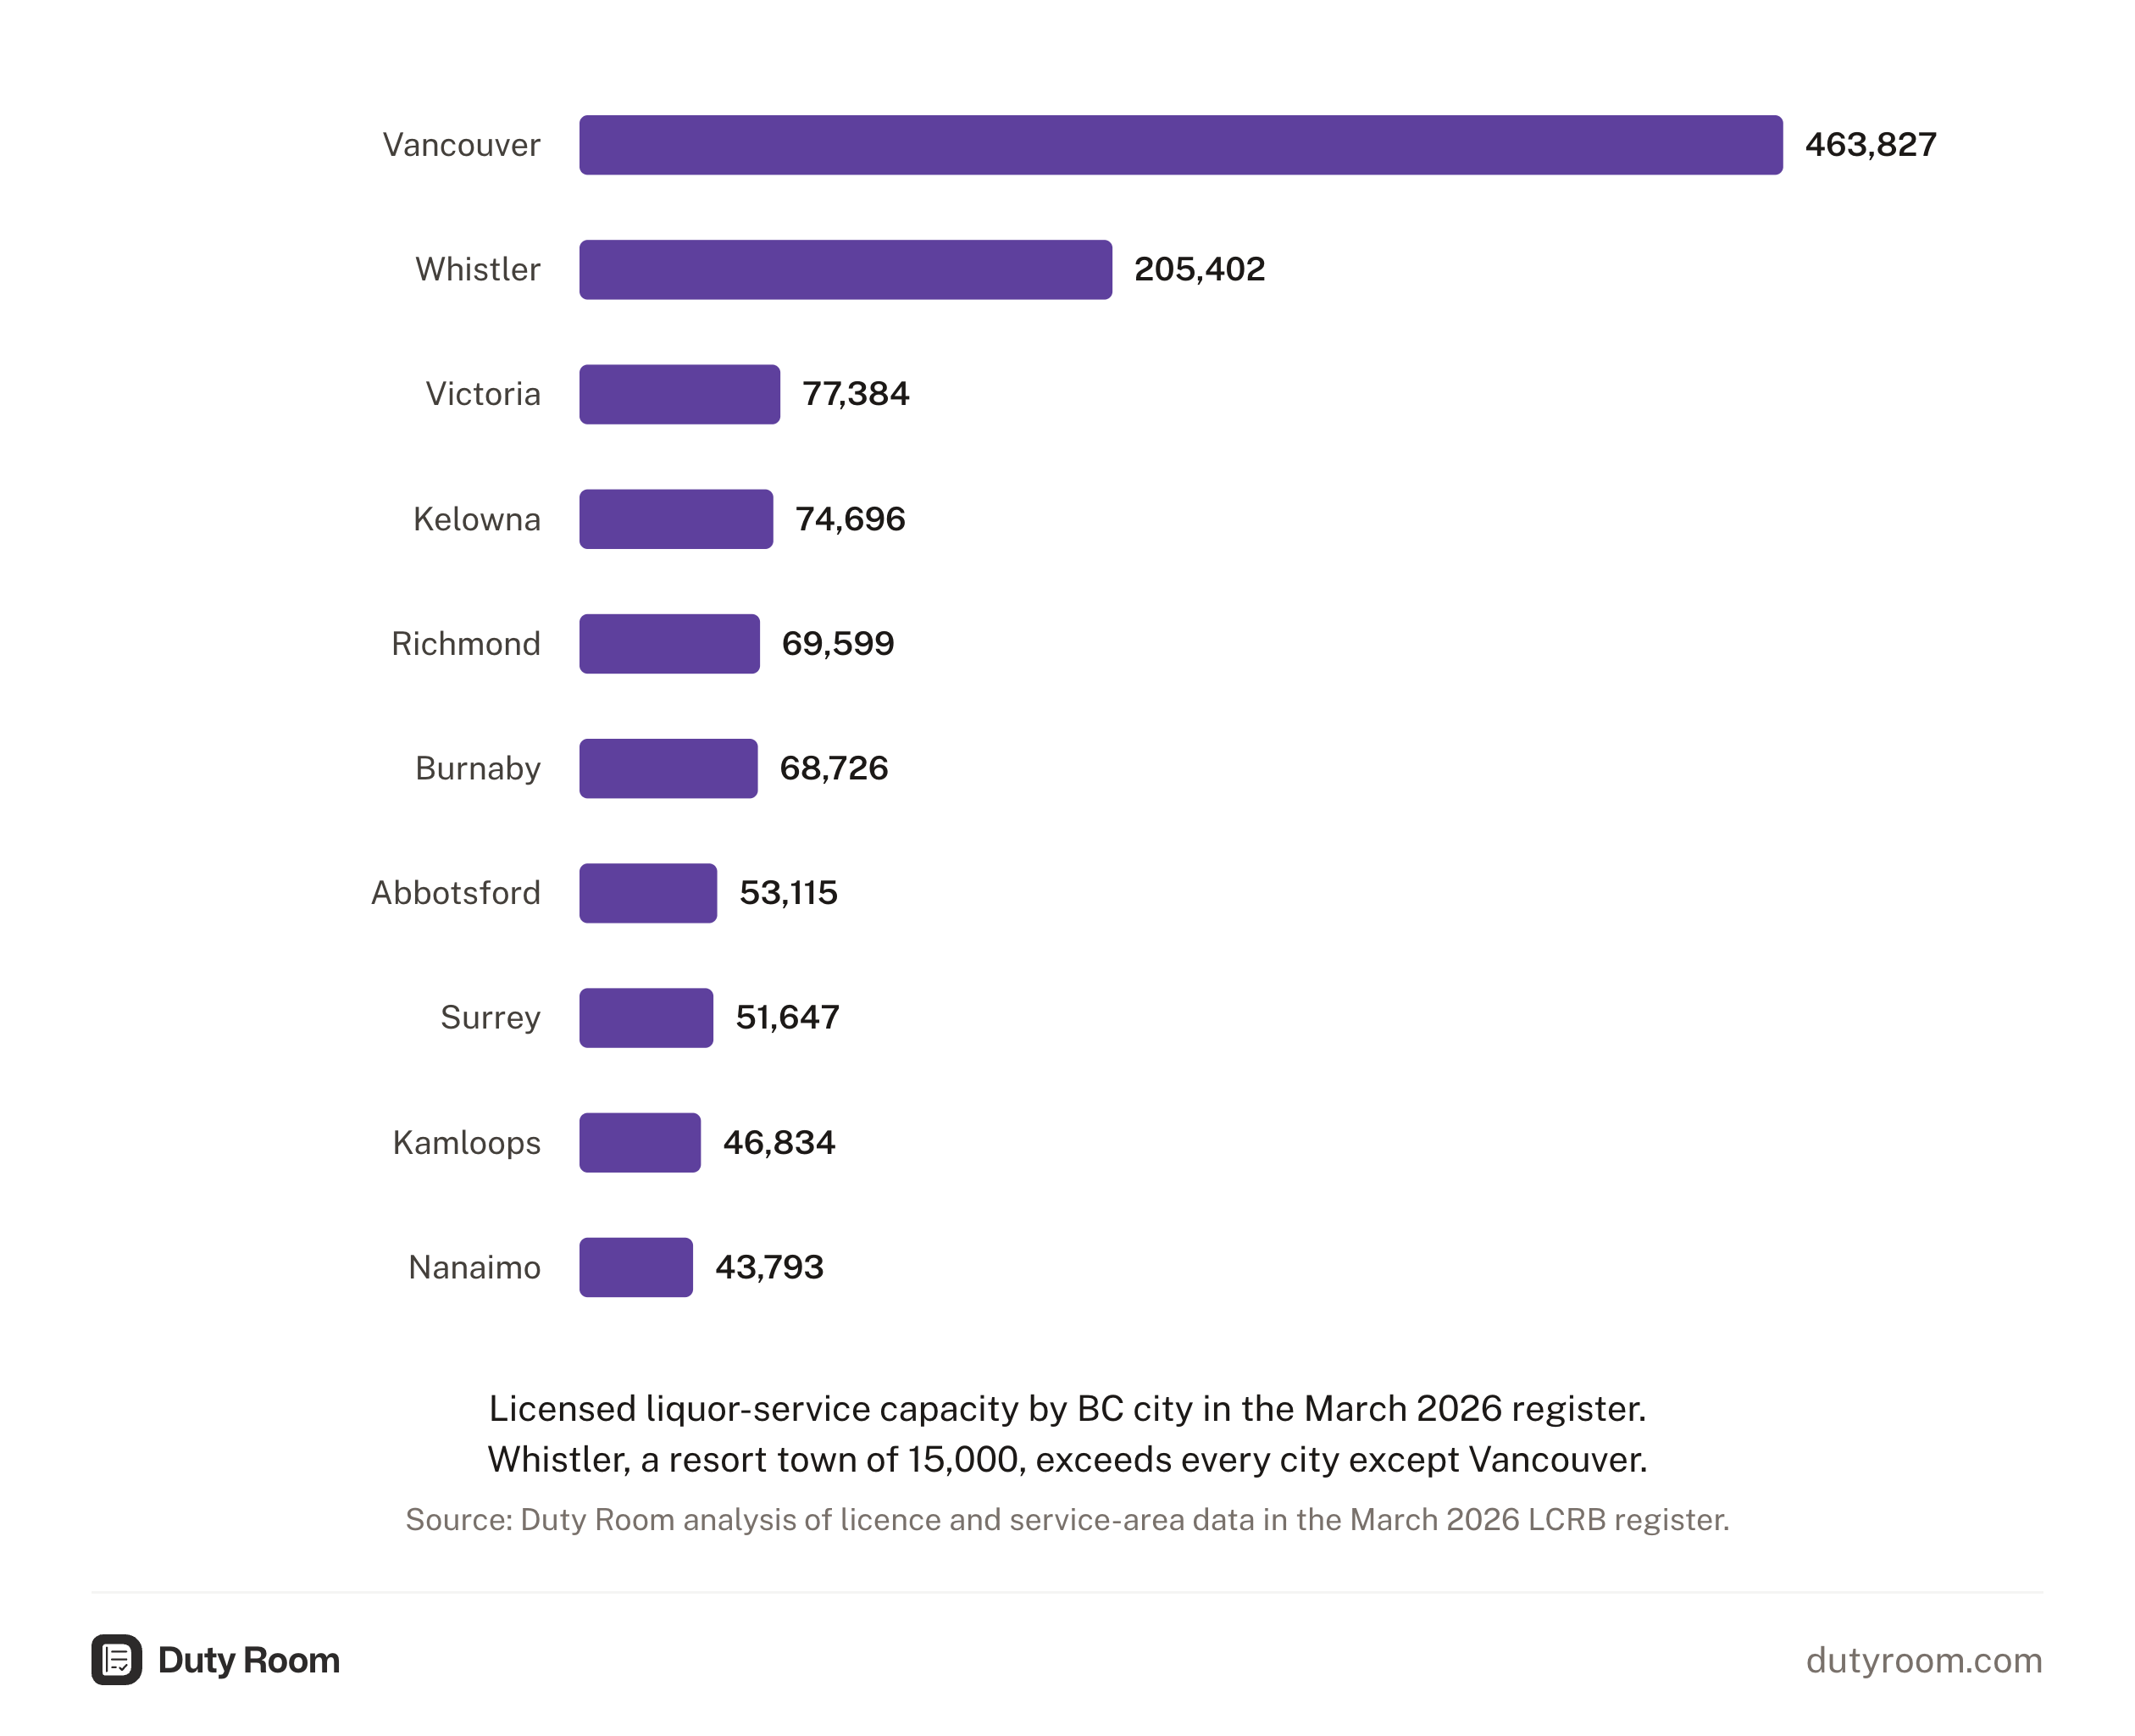
| Source geography | Summed capacity |
|---|---|
| City of Vancouver | 471,874 |
| Whistler | 220,710 |
| Victoria | 77,869 |
| Kelowna | 77,115 |
| Richmond | 69,892 |
| City of Burnaby | 69,391 |
| Abbotsford (City of) | 53,060 |
| Surrey | 50,967 |
| Kamloops (city of) | 46,949 |
| Nanaimo | 45,670 |
The grouping uses the service-area sheet's local-government/Indigenous-nation field. Labels such as City of Vancouver and Metro Vancouver Regional District are retained separately. They are not interchangeable with postal cities or regional populations.
Whistler records 220,710, including Merlins at 91,320 and Dusty's at 87,168. Those two licence IDs account for 178,488, or 80.9%, of Whistler's recorded sum. Dusty's rises from 72,168 in March to 87,168 in September; its service-area rows rise from nine to ten. That is a workbook observation, not evidence of a matching increase in simultaneous operating capacity.
Licence counts and capacity have different distributions
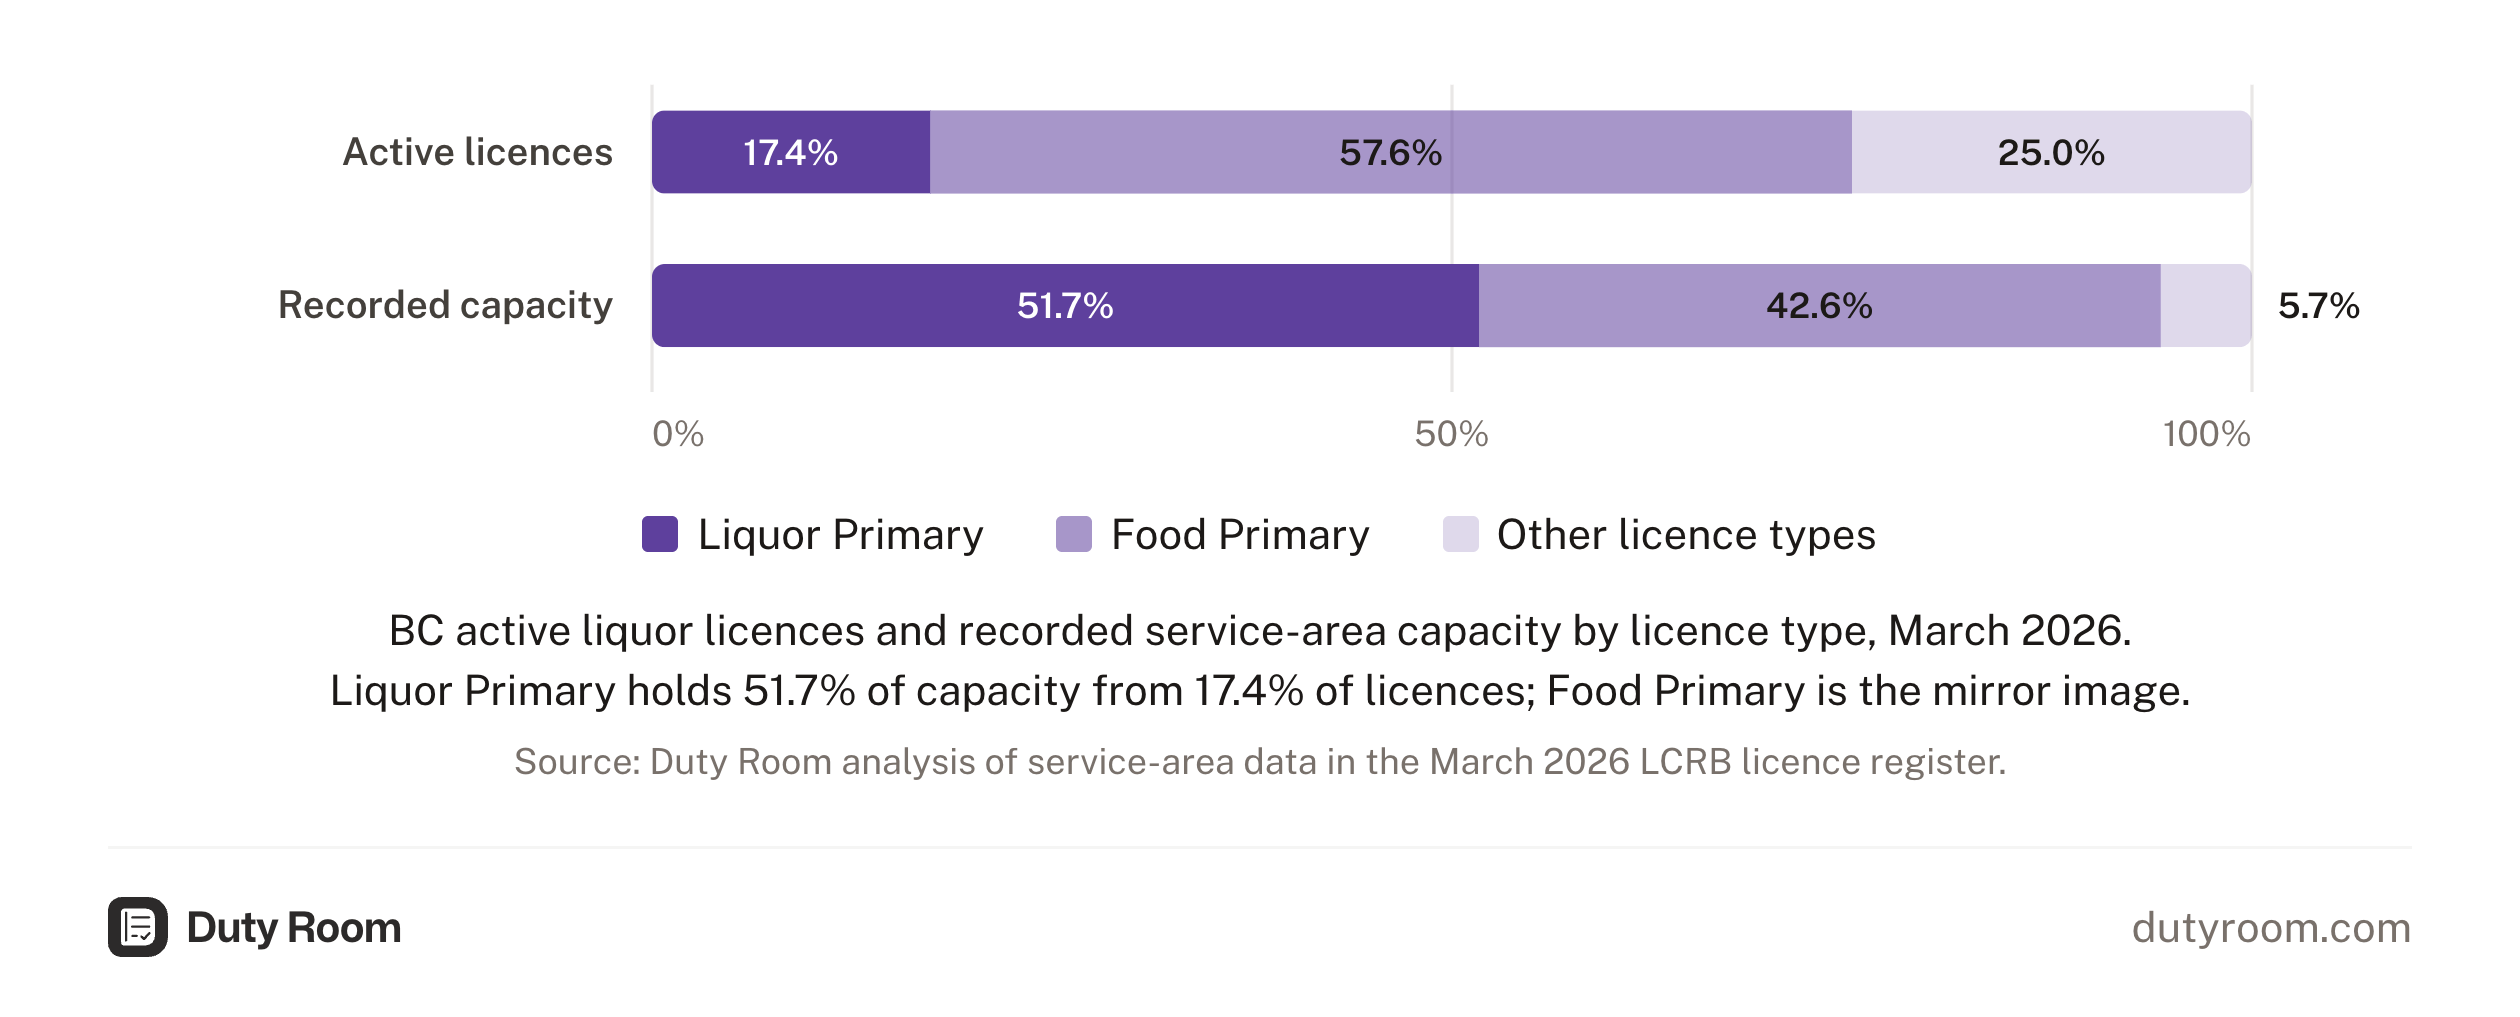
| Type | Licences | Share of licences | Summed capacity | Share of capacity |
|---|---|---|---|---|
| Food Primary | 6,116 | 57.9% | 917,989 | 41.8% |
| Liquor Primary | 1,847 | 17.5% | 1,157,301 | 52.7% |
| Liquor Primary Club | 259 | 2.5% | 63,192 | 2.9% |
| Manufacturer | 823 | 7.8% | 59,526 | 2.7% |
The licence-share denominator is all 10,562 active liquor licences. The capacity-share denominator is the 2,198,008 sum from the service-area sheet. Agents and several retail categories do not contribute recorded capacity. The 8,582 service-sheet licence IDs include 17 with zero summed capacity, one of them with only missing capacity. They should not be described as the entire hospitality sector.
Across these IDs, the median recorded sum is 100 and the mean is 256. BC Place alone records 98,020 across 13 service areas. Large venues pull the mean well above the median.
Keep population comparisons dated
Using the previously archived BC Stats 2025 population estimate of 5,697,536, September's sum is equivalent to 38.6% of the provincial population, compared with 37.4% for March. This is a scale comparison using a fixed historical population denominator. It is neither a 2026 population estimate nor a share of residents who can legally occupy licensed premises simultaneously.
Whistler's 2025 municipal population estimate of 15,090 gives 14.6 summed capacity units per resident in September, compared with 13.6 in March. Visitors, service-area conditions and the source geography limit what that ratio can tell us.
The market map describes the licence stock. The waivers-by-city report remains a separate March waiver snapshot; this September register must not silently replace its historical denominator.
Sources and method
The LCRB workbook is a rolling download. Duty Room preserved the March, July and September versions, retained licence numbers including leading zeros, and extracted by column headers because the workbook schema changed. Capacity is summed once per service-area row, then grouped by licence ID, licence type or the source geography. Raw workbooks, hashes, per-licence totals and revision comparisons are archived in the research vault. Population denominators remain the BC Stats 2025 estimates archived on 29 July 2026.
This report is based on published enforcement data, sources available at publication, and original analysis. It is for general information only and doesn't constitute legal advice.
Keep capacity documents with the site
Upload licences, approved plans and capacity records to named folders for each site, so your team can find the source document.