Where Waivers Pile Up
BC's Liquor Enforcement Heat Map: Where the LCRB Is Watching
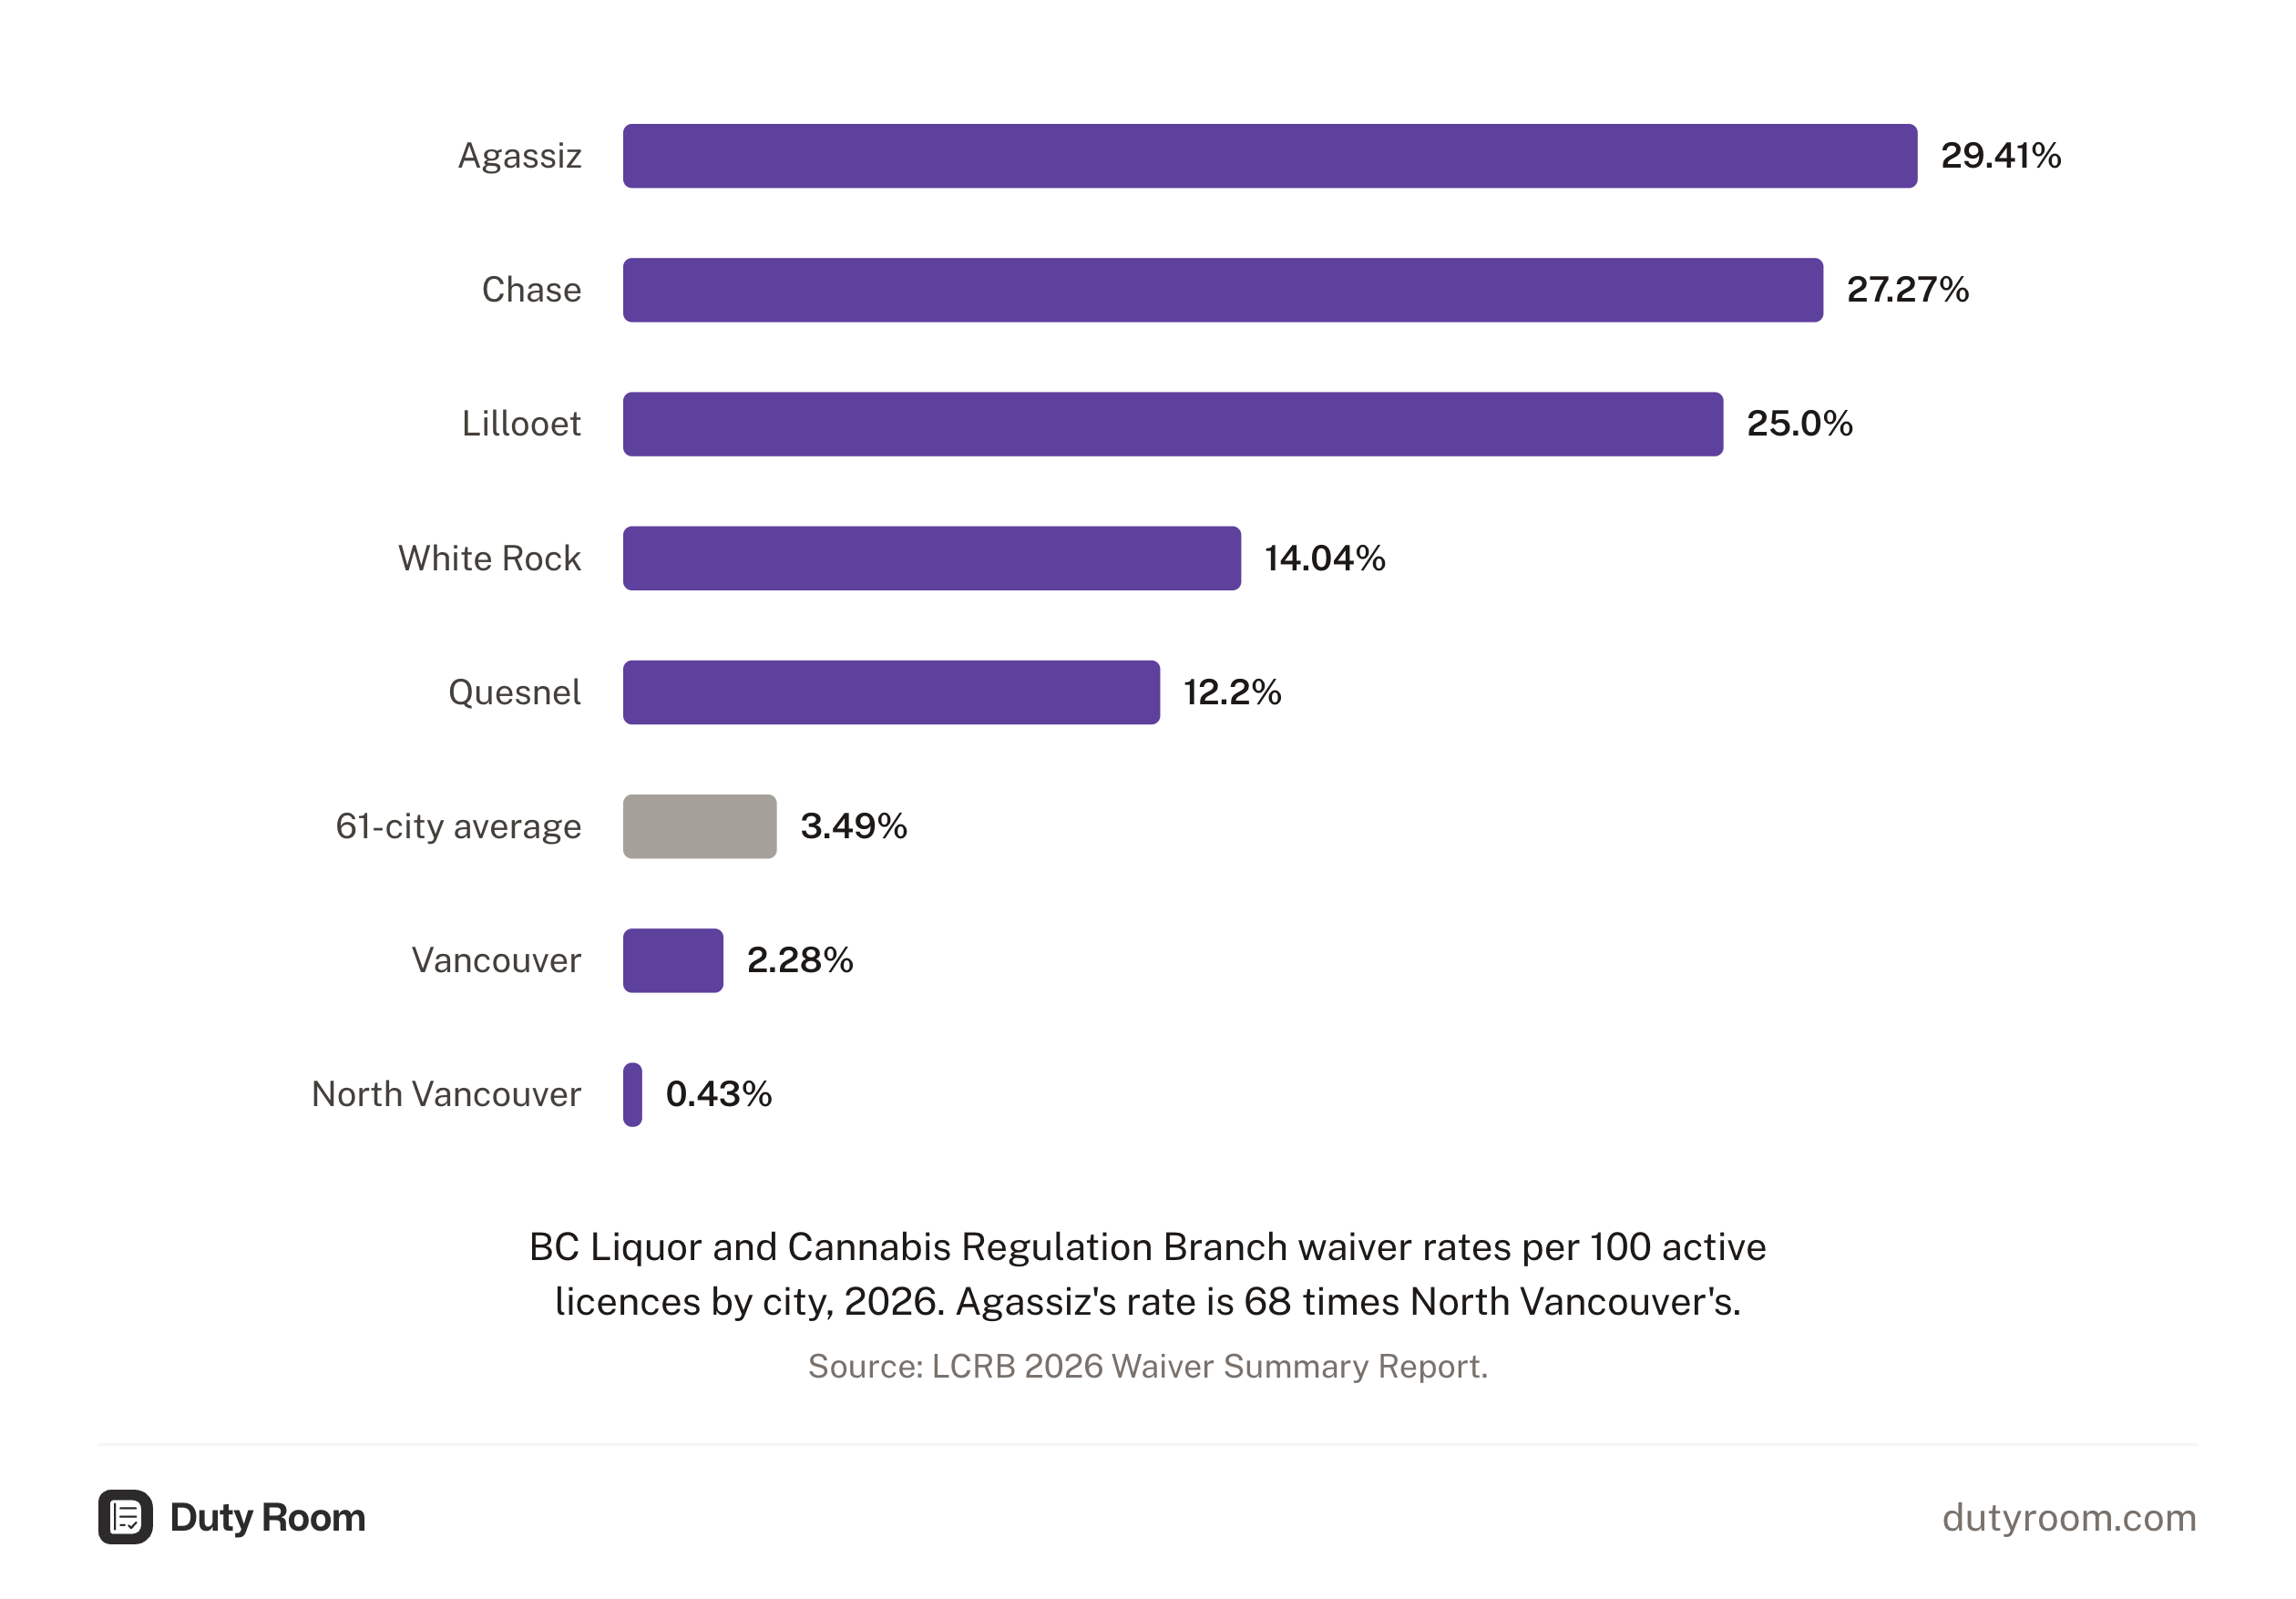
If you run a bar in White Rock, the LCRB's waiver data shows roughly one enforcement waiver for every seven licensed premises. White Rock has 57 active liquor licences and 8 enforcement waivers, a rate of 14.04 per 100 licences1. Vancouver, with 1,713 licences, produced 39 waivers, a rate of 2.28. Same regulator, same rules, very different rates.
That gap runs across the province. Of the 254 enforcement waivers, 249 map to 61 cities; against the LCRB's licence register of 10,572 active licences, the average across those cities is 3.49 waivers per 1002. That average hides a 68x spread3: Agassiz at 29.41 per 100, North Vancouver at 0.43.
| City | Licences | Waivers | Rate per 100 | Rank of 61 |
|---|---|---|---|---|
| Agassiz | 17 | 5 | 29.41 | 6th |
| Chase | 11 | 3 | 27.27 | 7th |
| Lillooet | 12 | 3 | 25.00 | 8th |
| White Rock | 57 | 8 | 14.04 | 13th |
| Quesnel | 41 | 5 | 12.20 | 14th |
| Avg across 61 matched cities | ~7,134 | 249 | 3.49 | — |
| Vancouver | 1,713 | 39 | 2.28 | 50th |
| North Vancouver | 232 | 1 | 0.43 | 61st |
All figures are drawn from the LCRB's 2026 Waiver Summary Report as it stood in spring 2026 (254 waivers covering February 2023 to November 2025), cross-referenced against the LCRB licence register of 10,572 active licences (March 2026 snapshot). The branch refreshes both files on a rolling basis, so the live versions no longer show the full set.
Highway Corridors and the Deployment Pattern
The most revealing pattern in the data isn't about which towns have worse compliance. It's about how the LCRB deploys its enforcement teams.
Three of the five highest-enforcement cities with at least ten licences sit within the Interior's highway network: Agassiz, Chase, and Lillooet. These aren't big towns. They have 17, 11, and 12 liquor licences respectively.
| City | Licences | Waivers | Rate per 100 | vs. Vancouver |
|---|---|---|---|---|
| Agassiz | 17 | 5 | 29.41 | 12.9x |
| Chase | 11 | 3 | 27.27 | 12.0x |
| Lillooet | 12 | 3 | 25.00 | 11.0x |
| Quesnel | 41 | 5 | 12.20 | 5.4x |
| Salmon Arm | 57 | 5 | 8.77 | 3.8x |
LCRB 2026 Waiver Summary Report, matched against the active licence register2.
The LCRB does not publish deployment schedules, but the geographic clustering within the Interior's highway network is consistent with multi-day road trips. MAP teams don't station inspectors in every town. They appear to deploy on sweeps, conducting test-purchase operations at licensed venues along a route. When a MAP team passes through Agassiz on a Tuesday afternoon, it can visit most of the town's licensed premises in a single day. In Vancouver, the same team would cover a fraction of one neighbourhood.
A caveat on the smallest towns: Agassiz's 17 licences and Chase's 11 mean a single MAP sweep could produce the entire enforcement count. These rates reflect real enforcement activity, but they don't necessarily indicate chronic compliance problems. They indicate that a MAP team visited and found failures, which is different from saying those towns are twelve times worse than Vancouver at checking ID.
Communities with fewer than 50 licences face enforcement rates 4.1 times higher than cities with 100 or more4 (10.09 per 100 vs. 2.45), based on the same waiver data. Small towns absorb a disproportionate share of enforcement activity relative to their licence counts.
How MAP Works
Selling to a minor accounts for 165 of the 254 waiver records, 65 percent of accepted waivers. 157 of those sales were liquor, the other 8 cannabis. The standard penalty is $7,000 or a 7-day licence suspension, operator's choice, per BC Reg. 241/2016.
MAP works by sending agents who are under 19 (the legal drinking age) into licensed premises to order drinks. The agents are real minors. They don't lie and they don't carry fake ID. Ask for identification and they tell you it's in the car, or that they don't have it. The test is whether your server refuses the sale at that point. If the server doesn't ask for ID, or asks and serves anyway, the establishment gets a contravention notice.
The seasonal data tells you when MAP teams are most active. January through March and May through July are the heavy months, with October the quietest. The early-year peak appears to align with coordinated province-wide test-purchase sweeps: in early 2025, every multi-site operator caught by MAP, including Northland Properties, White Spot, GolfBC, and Moxie's, was hit between January and May.
For repeat offences, the penalties escalate sharply. A second contravention of selling to a minor jumps to $11,000-$15,000 or an 11- to 21-day suspension. A third: $15,000-$25,000 or 21 to 41 days.
Tourist Towns and the Seasonal Staff Problem
Resort communities face elevated enforcement rates that likely reflect their workforce composition.
Tofino, with 33 licences, recorded 4 waivers for a rate of 12.12 per 100, per LCRB waiver data. Revelstoke, with 68 licences, had 5 waivers at 7.35 per 100. These towns share a common staffing challenge that likely contributes to elevated enforcement rates: high seasonal turnover, young workers arriving for ski season or summer, and short training windows. For example, a 19-year-old from Alberta, where the drinking age is 18, serving drinks in Revelstoke might not think twice about a patron who looks close to the line. A MAP test doesn't measure judgment about close enough; it measures whether your server asked for ID.
White Rock fits a similar pattern. Geographically wedged between Surrey and the US border, it has more in common with a tourist destination than a commuter suburb. A White Rock craft-brewery operator accumulated two LCRB contraventions and eight ESB violations across its premises between late 2024 and late 2025, per ESB and LCRB cross-referenced enforcement records. The ESB register publishes determinations as issued and does not show appeal status. The cross-domain overlap shows enforcement patterns are visible across regulators, not just the LCRB. Operators that appear in one regulator's data are worth checking against others.
Metro Vancouver's False Sense of Security
The Metro Vancouver suburbs cluster at the bottom of the enforcement table. Surrey (417 licences, 1.20 per 100), Coquitlam (166, 1.20), Richmond (418, 1.44), Langley (225, 1.78), Burnaby (279, 2.15). All well below the average.
And the pattern isn't only a Lower Mainland story. Langford, on southern Vancouver Island, posted a 10.00 per 100 rate from just 50 licences, 4.4 times Vancouver. Any community small enough for a MAP team to cover in a day or two can produce a concentrated burst of enforcement activity.
And Vancouver still produced 39 enforcement waivers in absolute terms, more than any other city. With 1,713 licences, that works out to about one waiver for every 44 licences. That's low, but it's not zero.
Preparation Based on the Data
Where you operate affects how often a MAP team walks through your door. It doesn't change whether your staff are ready when one does. An operator in Agassiz sits in the most heavily enforced town in the data. An operator in North Vancouver might never see a MAP team.
That doesn't make the preparation optional. Here is what the data points to.
ID every patron who could plausibly be under 30. The LCRB's tribunal decisions treat ID checks as the baseline. In the 2026 Cuevas Holdings ruling (2026 BCLCRB 5), a server asked a minor agent for ID, was told it was in the car, and served the beer anyway. The licensee still walked away with a complete due diligence defence because it could document an under-30 ID policy, ongoing training, and supervision on every shift. The due diligence playbook covers the documentation that makes that defence work.
Train seasonal staff before their first shift. Serving It Right certification is mandatory, but certification alone isn't a defence. You need documented training on your venue's specific ID-checking procedures.
Watch the calendar. January through March is peak MAP season. If you're going to run a training refresher, do it in December.
The LCRB doesn't publish its MAP deployment schedule or inspection counts by city. The geographic enforcement data here is derived from public waiver summary reports cross-referenced against the licence register. It's the closest thing to an enforcement heat map that exists for BC liquor regulation, and it shows a province where enforcement resources land very differently depending on where you pour.
Reference: Enforcement Rates by City
| City | Licences | Waivers | Rate/100 | Rank |
|---|---|---|---|---|
| Agassiz* | 17 | 5 | 29.41 | 6th |
| Chase* | 11 | 3 | 27.27 | 7th |
| Lillooet* | 12 | 3 | 25.00 | 8th |
| White Rock | 57 | 8 | 14.04 | 13th |
| Quesnel | 41 | 5 | 12.20 | 14th |
| Tofino | 33 | 4 | 12.12 | 15th |
| Fort St. John | 53 | 6 | 11.32 | 16th |
| Langford | 50 | 5 | 10.00 | 17th |
| Salmon Arm | 57 | 5 | 8.77 | 18th |
| Revelstoke | 68 | 5 | 7.35 | 22nd |
| Kamloops | 213 | 10 | 4.69 | 37th |
| Nanaimo | 204 | 9 | 4.41 | 39th |
| Kelowna | 406 | 14 | 3.45 | 45th |
| Avg across 61 matched cities | 3.49 | |||
| Vancouver | 1,713 | 39 | 2.28 | 50th |
| Burnaby | 279 | 6 | 2.15 | 53rd |
| Victoria | 541 | 10 | 1.85 | 55th |
| Richmond | 418 | 6 | 1.44 | 57th |
| Surrey | 417 | 5 | 1.20 | 59th |
| North Vancouver | 232 | 1 | 0.43 | 61st |
*Small sample: fewer than 20 licences. A single MAP sweep could account for the entire count.
LCRB 2026 Waiver Summary Report, 249 waivers matched to 61 cities. Rates are waivers per 100 licences within the matched cities2, and reflect waiver acceptances only, not total enforcement activity.
-
Duty Room analysis of the LCRB 2026 Waiver Summary Report and active licence register, extracted March 2026: White Rock's 8 enforcement waivers across 57 active liquor licences, 14.04 per 100.
-
Duty Room analysis of the LCRB 2026 Waiver Summary Report and active licence register, extracted March 2026. Rates are waivers per 100 licences within the 61 matched cities, which together hold about 7,134 licences; against the full register, the average would be 2.36 per 100.
-
Duty Room analysis of the LCRB 2026 Waiver Summary Report and active licence register, extracted March 2026: Agassiz 29.41 waivers per 100 against North Vancouver's 0.43, a 68x spread.
-
Duty Room analysis of the LCRB 2026 Waiver Summary Report and active licence register, extracted March 2026: communities with fewer than 50 licences average 10.09 waivers per 100, against 2.45 for cities with 100 or more, a ratio of 4.1x.
This report is based on published enforcement data, sources available at publication, and original analysis. It is for general information only and doesn't constitute legal advice.
ID compliance tracking by location
Duty Room logs ID checks, refusals, and training records per site. Each location can show its own compliance history.