Autumn is busy season
DBPR Inspection Seasonal Patterns: When Inspectors Come
Pull 142,203 DBPR food inspections from the completed 2025-26 fiscal year and a pattern emerges that's about as random as a bus schedule.1
October is the peak month
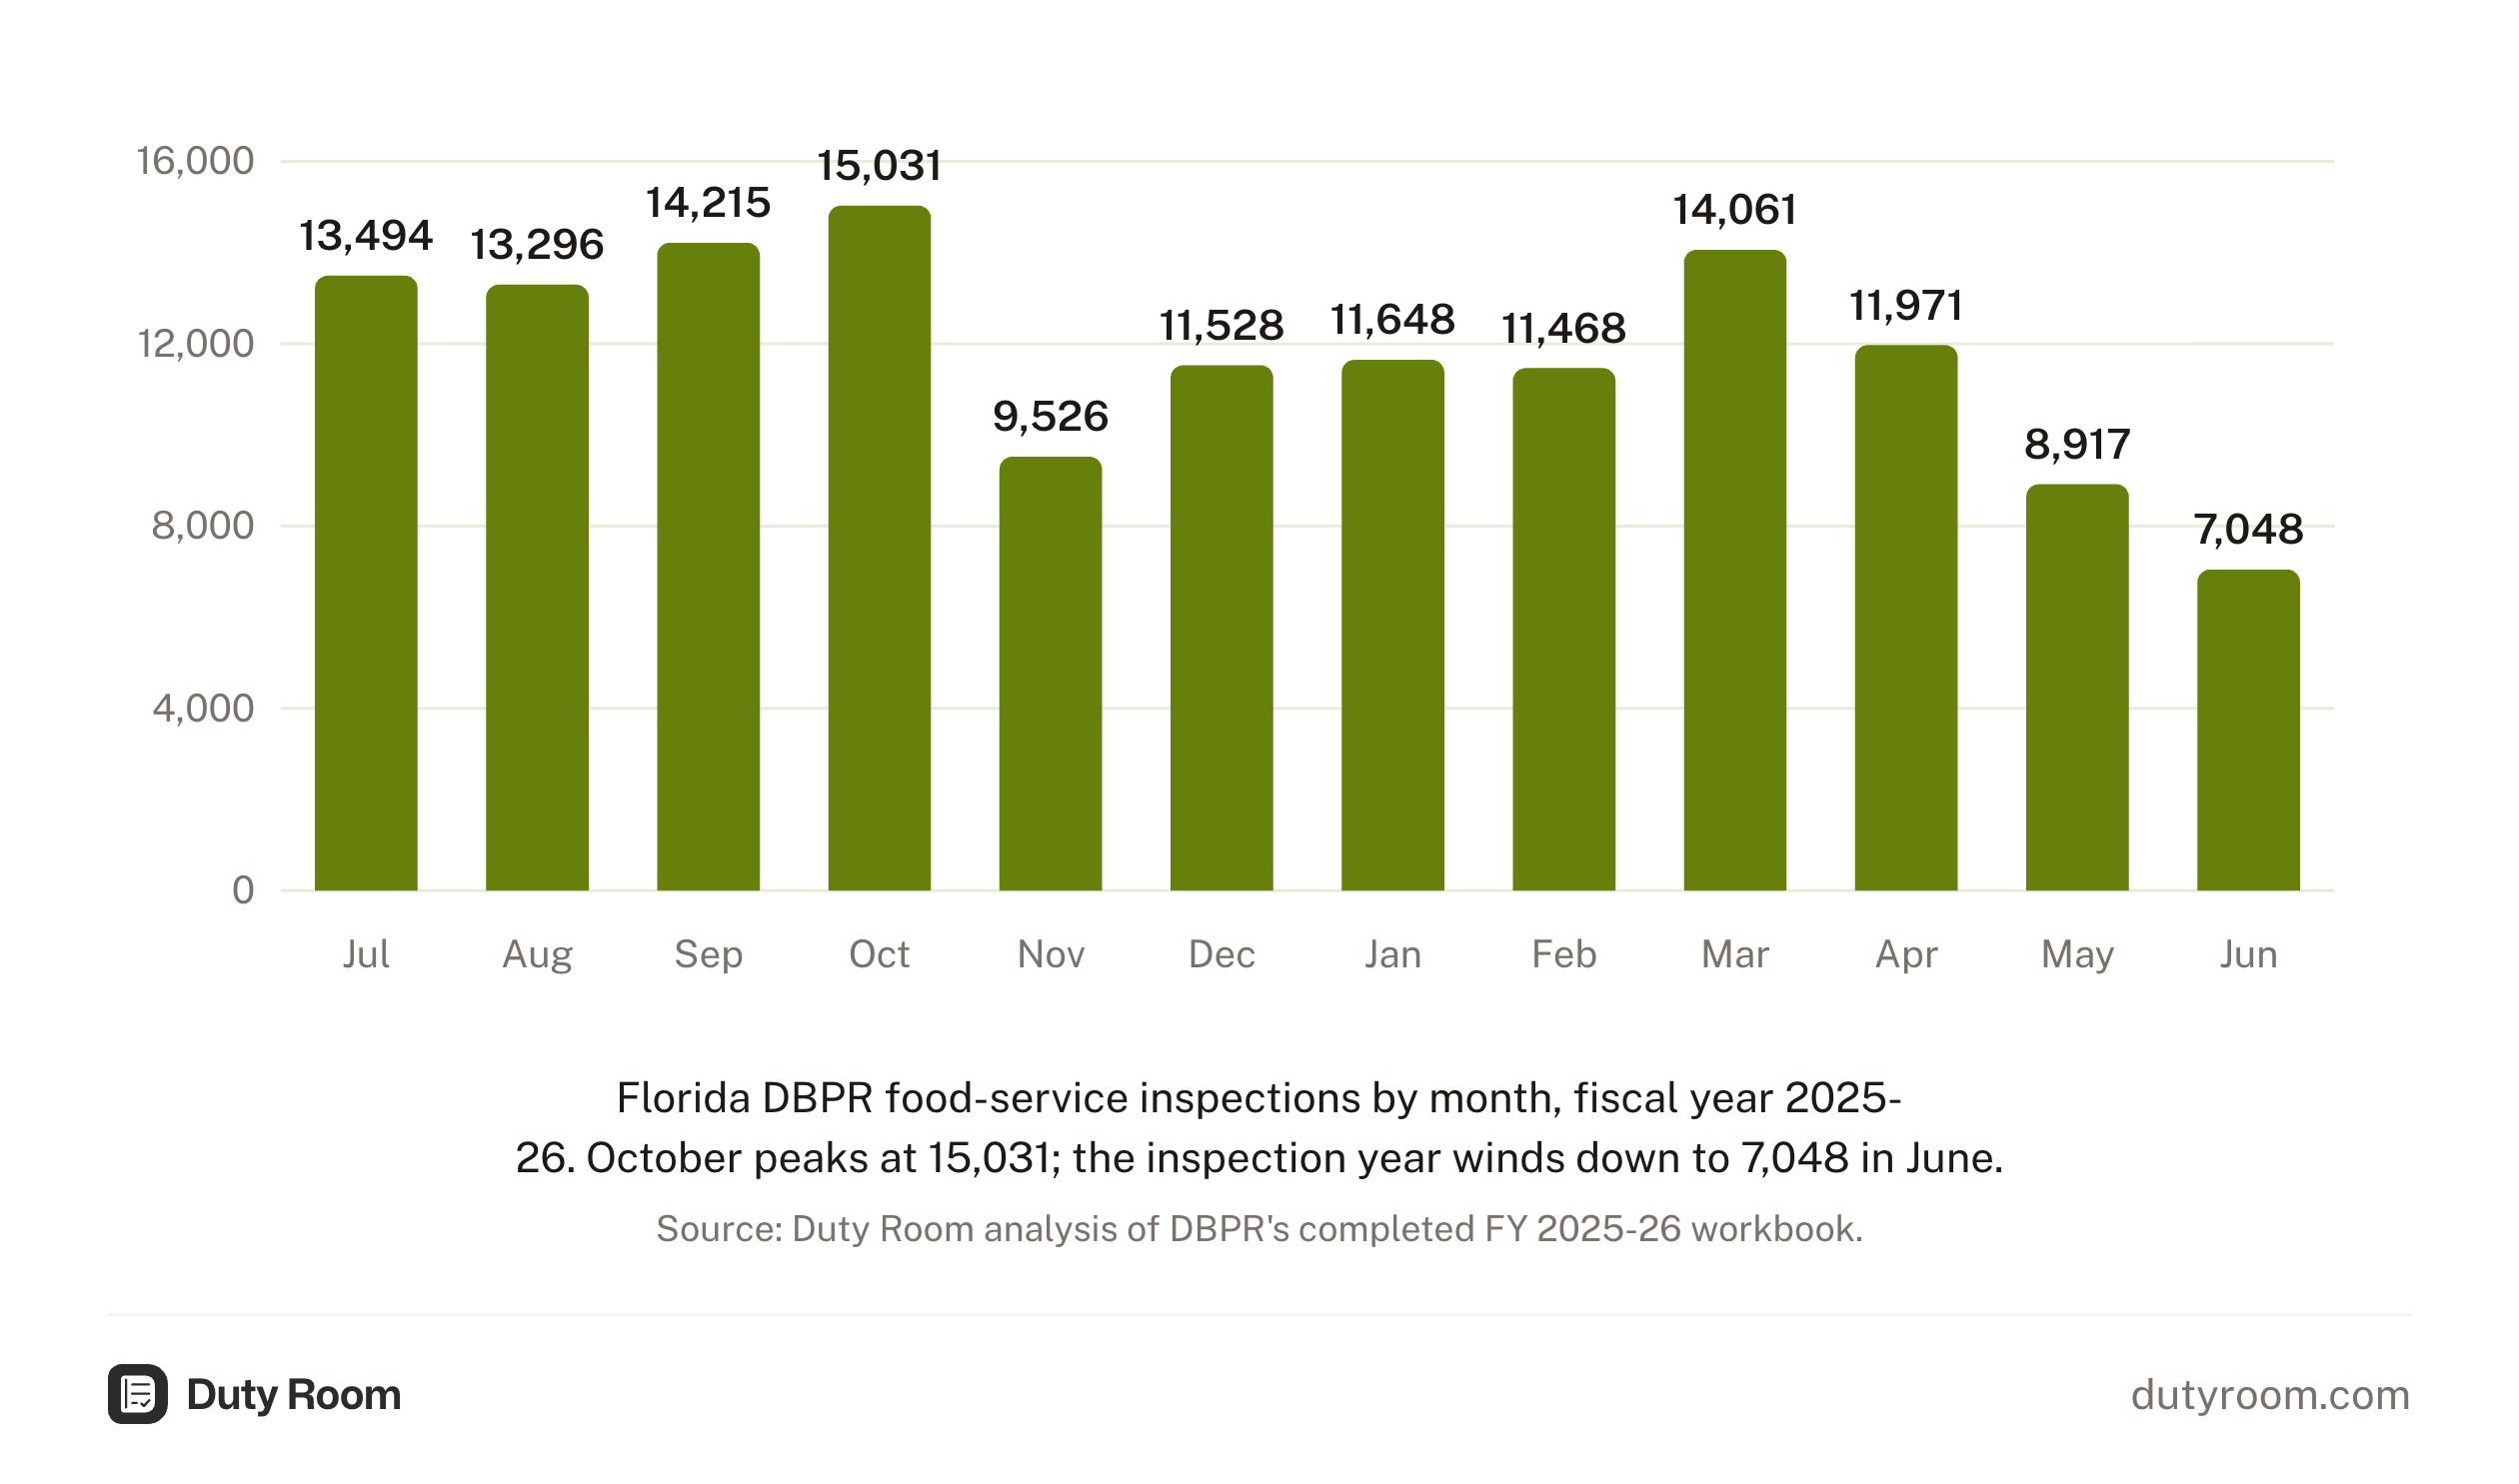
Florida's inspection year follows the tourist season. October sits at the top with 15,031 inspections statewide. September runs close behind at 14,215, a pre-season push before the crowds arrive.
November, not December, is the quiet month of the holiday stretch. Thanksgiving compresses the schedule. The November count was 9,526, 37% lower than October.
Spring carries elevated activity too. March logged 14,061 inspections, behind only October and September, as spring break crowds arrive. Then the year runs down: May logged 8,917 inspections and June fell to the year's low of 7,048. The prior fiscal year faded the same way into its June 30 close.
| Month | Inspections |
|---|---|
| July 2025 | 13,494 |
| August 2025 | 13,296 |
| September 2025 | 14,215 |
| October 2025 | 15,031 |
| November 2025 | 9,526 |
| December 2025 | 11,528 |
| January 2026 | 11,648 |
| February 2026 | 11,468 |
| March 2026 | 14,061 |
| April 2026 | 11,971 |
| May 2026 | 8,917 |
| June 2026 | 7,048 |
Closures peak in summer, not October
Most operators would expect closures to peak alongside inspections in October. They don't.
July had the most emergency closure orders: 166 in July 2025. September was next at 155, then October, the peak inspection month, at 151, with August at 145. July also had the year's highest closure rate: 1.2% of its inspections ended in an emergency order, against 0.8% in November. So kitchens fail at higher rates in summer, and it isn't inspector activity driving it. The likelier culprit is the environment: heat and humidity working against every cooler, prep surface, and pest-control routine in the building.
The fewest closures came in May (74). November and June followed at 77 each, also months when inspection volume was low.
Tuesday through Thursday is your real window
The day-of-week pattern is more useful than the seasonal one.
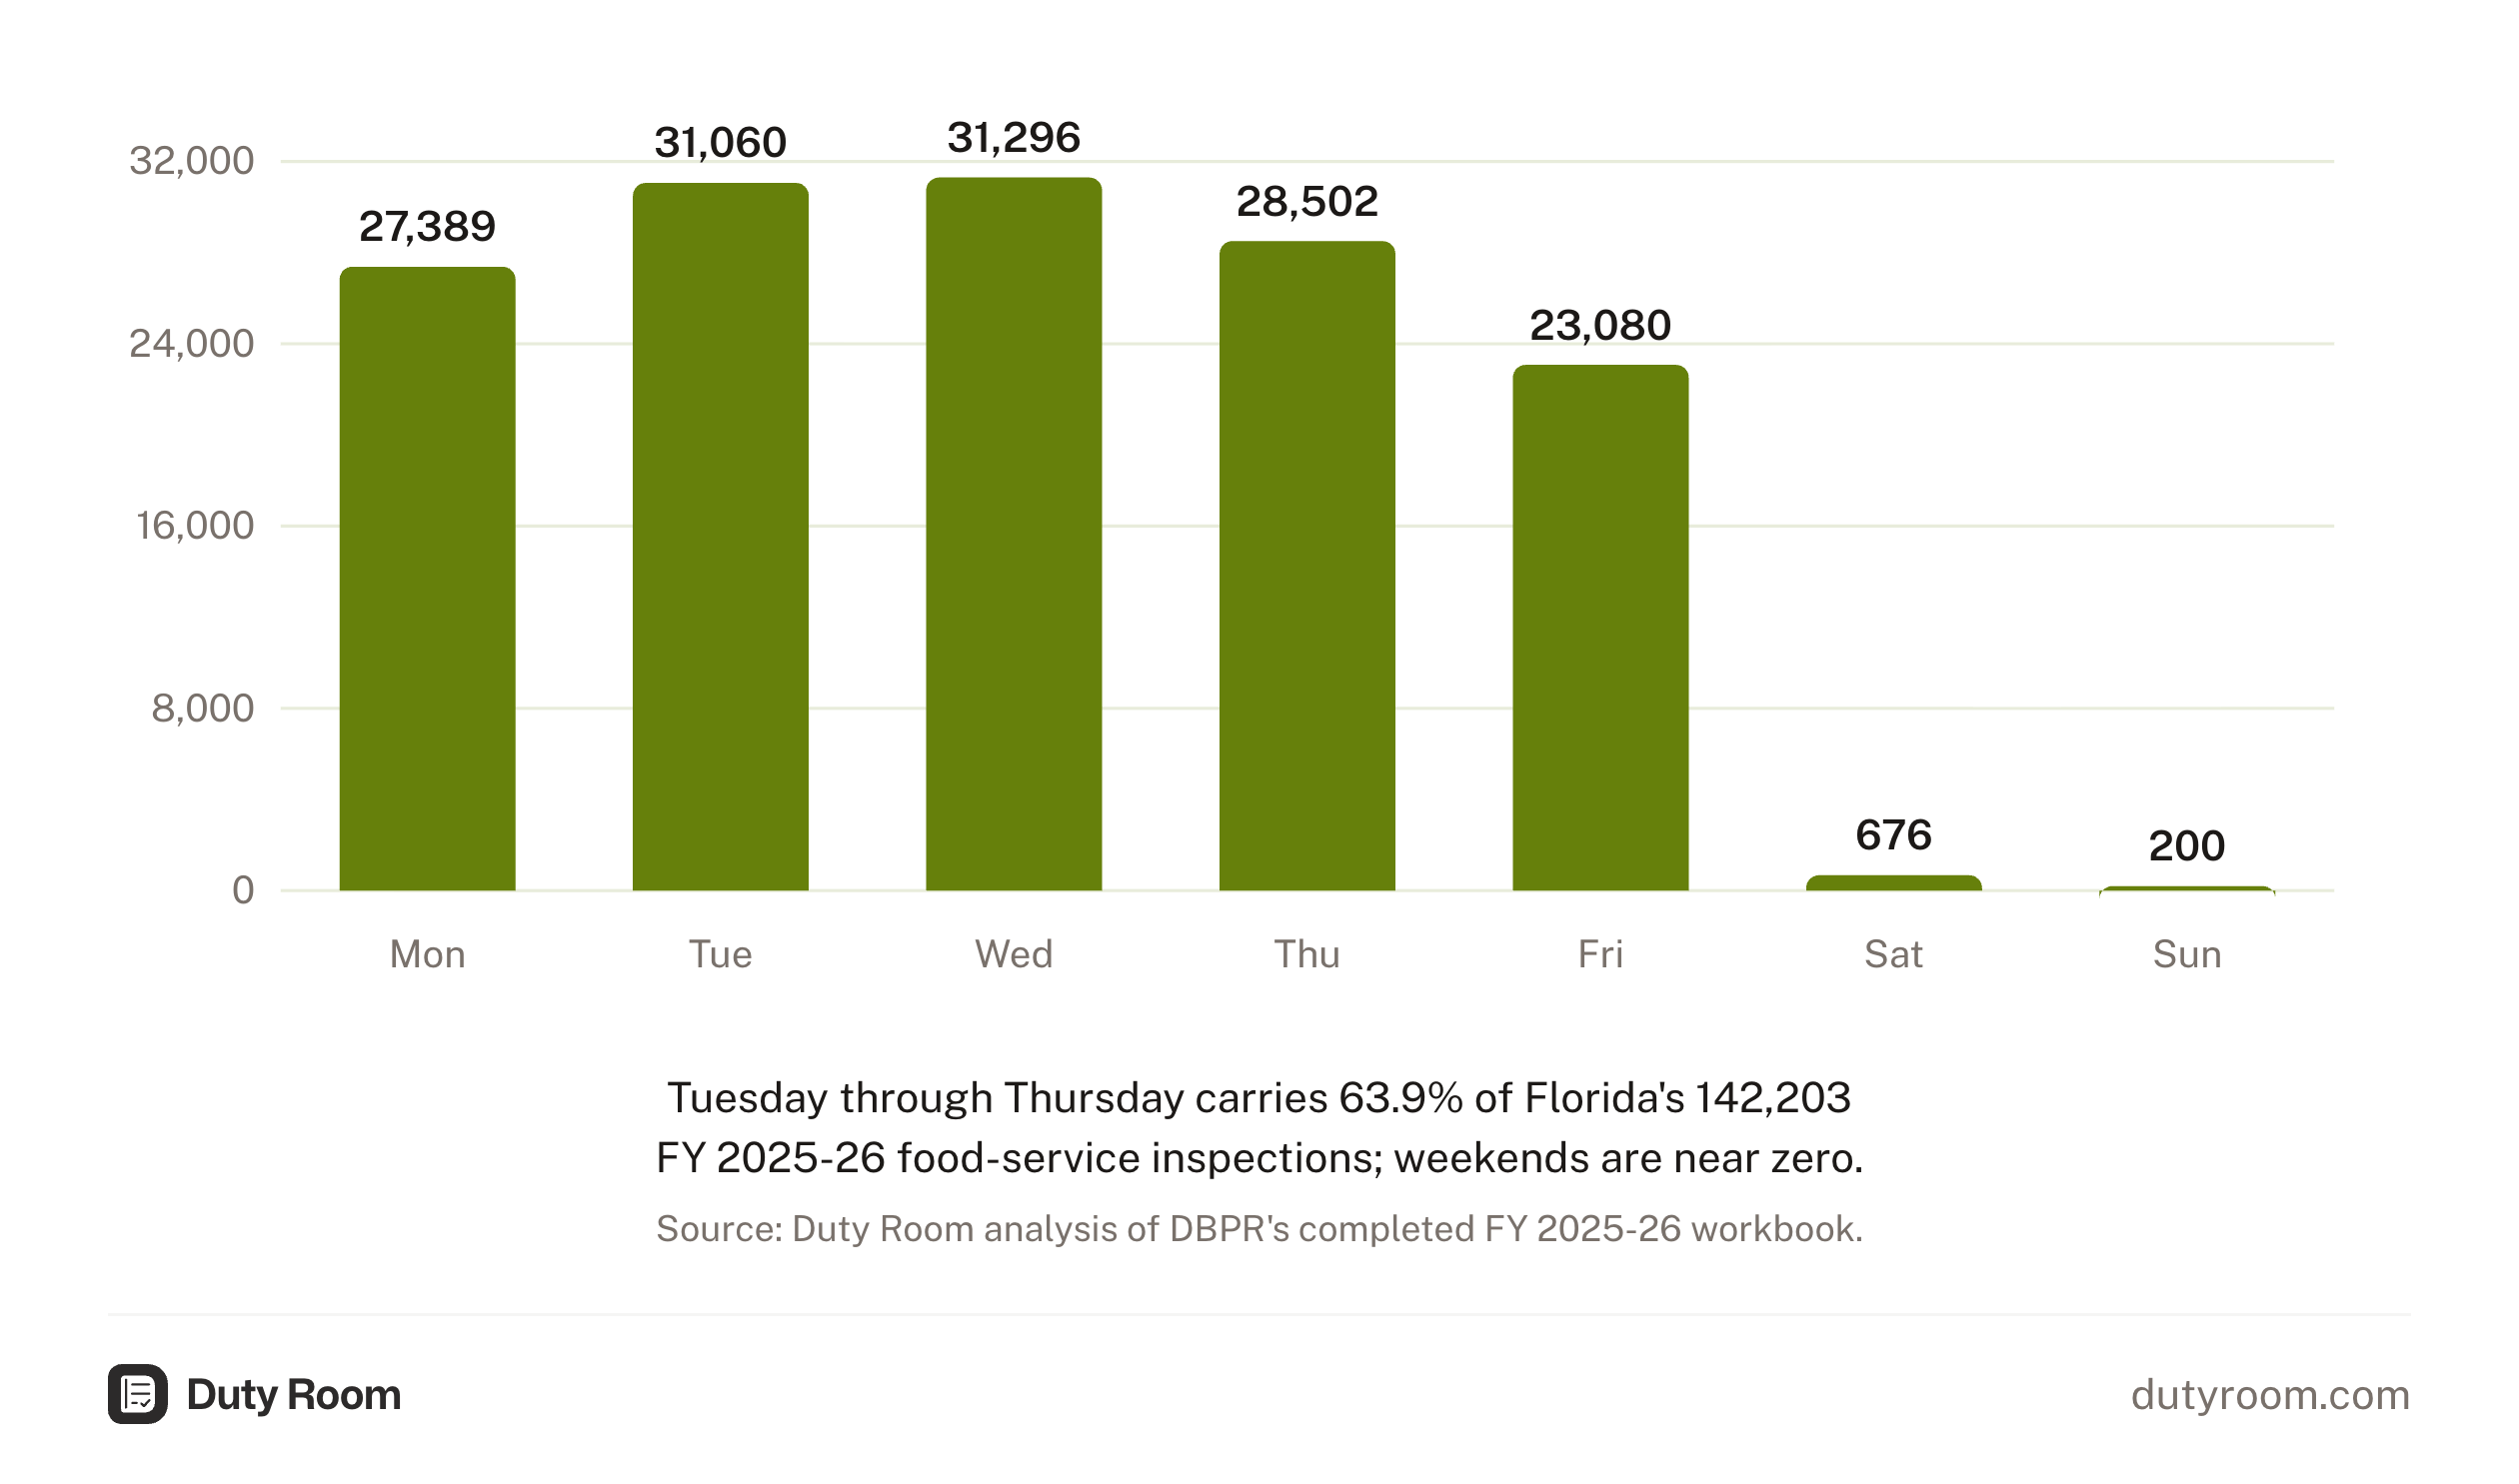
99.4% of DBPR inspections happen on weekdays. Saturday and Sunday together account for 876 inspections out of 142,203. For practical purposes, there are no weekend inspections.
Wednesday leads at 31,296 (22.0%), followed by Tuesday at 31,060 (21.8%), Thursday at 28,502 (20.0%), Monday at 27,389 (19.3%), and Friday at 23,080 (16.2%). The three-day window from Tuesday through Thursday accounts for 63.9% of all inspections. Friday runs about a quarter lighter than the Tuesday-to-Thursday average.
| Day | Inspections | Share |
|---|---|---|
| Monday | 27,389 | 19.3% |
| Tuesday | 31,060 | 21.8% |
| Wednesday | 31,296 | 22.0% |
| Thursday | 28,502 | 20.0% |
| Friday | 23,080 | 16.2% |
| Saturday | 676 | 0.5% |
| Sunday | 200 | 0.1% |
If your kitchen runs loose mid-week when prep pressure is highest and management attention is split, that's when the inspector is most likely to walk in.
How often they come depends on your risk level
Florida's risk-based model sets inspection frequency by level. For a permanent restaurant, the ladder works like this.
Level 1 covers establishments that don't cook raw animal food, or that cook but don't cool: one inspection per year. Level 2 is the most common: you cook raw animal food and you cool cooked food, two inspections per year. About 60% of Florida's 65,597 active licences sit here. Most full-service restaurants land at Level 2.
Level 3 is three inspections per year, triggered by three or more disciplinary actions in two years, or by serving a highly susceptible population. 253 establishments are at Level 3 statewide. Level 4 is four per year, reserved for a confirmed foodborne illness connection. 42 establishments are currently there.
Your level isn't a fixed label. It's a formula. Two disciplinary actions puts you one away from a frequency increase.
Where you operate affects your odds too
The seasonal and weekday data is statewide, and inspection tempo itself is even: every big county lands close to two inspections per active establishment, which is what the Level 2 requirement predicts. What varies is what happens when the inspector finds problems.
Among Florida's major restaurant markets, the enforcement rate (formal actions per active establishment) runs from 50.2% in Duval County (Jacksonville) down to 2.2% in Osceola County (Kissimmee). Jacksonville generates roughly 23 times the formal enforcement actions per establishment that Kissimmee does. And the heaviest-enforced corner of the state isn't Miami: DBPR's District 2, covering Broward, Palm Beach and Martin counties, produced a third of all disciplinary actions over the past six years from about 15% of the state's establishments, while District 1 (Miami-Dade and Monroe) produced under 7%.
What to do with this
October and July point in opposite directions. In October, the risk is administrative: food manager certifications should be current, temperature logs consistent, pest control visits not overdue. In July, the risk is physical. Check your refrigeration equipment and verify cold holding temperatures under summer heat load, paying particular attention to anything that behaves differently when the kitchen is running hot.
Tuesday through Thursday is when to be sharpest. If your raw food separation or handwashing station supplies are going to slip, they're most likely to slip mid-week under service pressure.
DBPR completed 178,211 food service and lodging inspections in FY 2024-25 with 291 inspectors, and 98.3% of food service licences got the visits the statute requires. They're not going to miss you. The question is whether your kitchen looks the same on a Wednesday in October as it does on a Saturday night in January.
-
Duty Room analysis of the completed FY 2025-26 DBPR inspection workbook (142,203 records dated July 1, 2025 through June 30, 2026) and 65,597 active establishment records from DBPR daily extract files (myfloridalicense.com), retrieved 2026-07-29, cross-referenced with 72 months of monthly disciplinary activity reports covering January 2020 through December 2025. Statewide totals (178,211 inspections, 291 inspectors, the 98.3% completion rate, and the Level 3 and Level 4 establishment counts) are from the DBPR Hotels and Restaurants Annual Report FY 2024-25.
This briefing is based on sources available at publication and is for general information only. It doesn't constitute legal advice. For advice on your specific situation, consult a qualified professional.
The records the inspector looks for, per site
Florida operators keep temperature logs, Food Manager certifications, and cleaning records current for DBPR inspections. Duty Room organizes the evidence and shares it across every site.