The documentation gap
Food Hygiene Ratings in UK Hospitality: What 279,257 Rated Premises Show
This report covers England, Wales and Northern Ireland. Scotland operates a separate Food Hygiene Information Scheme and is not in scope.
Across 279,257 rated hospitality food businesses in England, Wales and Northern Ireland, 560 held a zero rating at the point of analysis. Zero is the bottom of the scale the Food Standards Agency runs and indicates that the inspector found conditions requiring urgent improvement at the visit on which the rating is based. The wider dataset shows the rating distribution across the whole sector, the component scores that move with low ratings, and the regional gap between London and the rest of England.
The dataset
Duty Room pulled the full Food Hygiene Rating Scheme dataset from the Food Standards Agency in April 2026. The export carries 602,830 UK food business records, and 339,780 of those are hospitality: pubs, bars, restaurants, cafés, hotels with catering, takeaways, and a catch-all "other catering" category that spans event caterers, workplace canteens and mobile operators. Scotland's 32,300 hospitality businesses sit under a separate scheme, the Food Hygiene Information Scheme, and come out before any statistic in this report; so do the 22,720 businesses awaiting inspection or publication of a first rating and the 5,503 the scheme exempts. That leaves 279,257 rated hospitality businesses in England, Wales and Northern Ireland.
The FHRS gives every inspected food business a rating from 5 (very good) down to 0 (urgent improvement necessary). Inspectors score three components (Hygiene, Structural Compliance, and Confidence in Management) under the Food Law Code of Practice; the overall rating is determined by the matrix the FSA publishes in the FHRS Brand Standard rather than by inspector discretion.
The points ranges for each component:
- Hygiene: 0 to 25 points. Food handling, preparation, cooking, cooling, reheating, storage.
- Structural Compliance: 0 to 25 points. Cleanliness, layout, lighting, ventilation, pest control, physical condition of facilities and equipment.
- Confidence in Management: 0 to 30 points. Food safety management system, HACCP documentation, staff training, track record of compliance.
Lower is better. Zero is perfect on any single component. The matrix also caps the rating when any one component exceeds a threshold, which is why a business with a strong total can still land a low rating when one area is badly out.
This report covers only what the data shows. It doesn't set out how to fix anything. The legal footing for all of it is Regulation (EC) 852/2004 as it applies in UK law, the Food Safety Act 1990, and the FSA's scheme documentation.
Rating distributions by sector
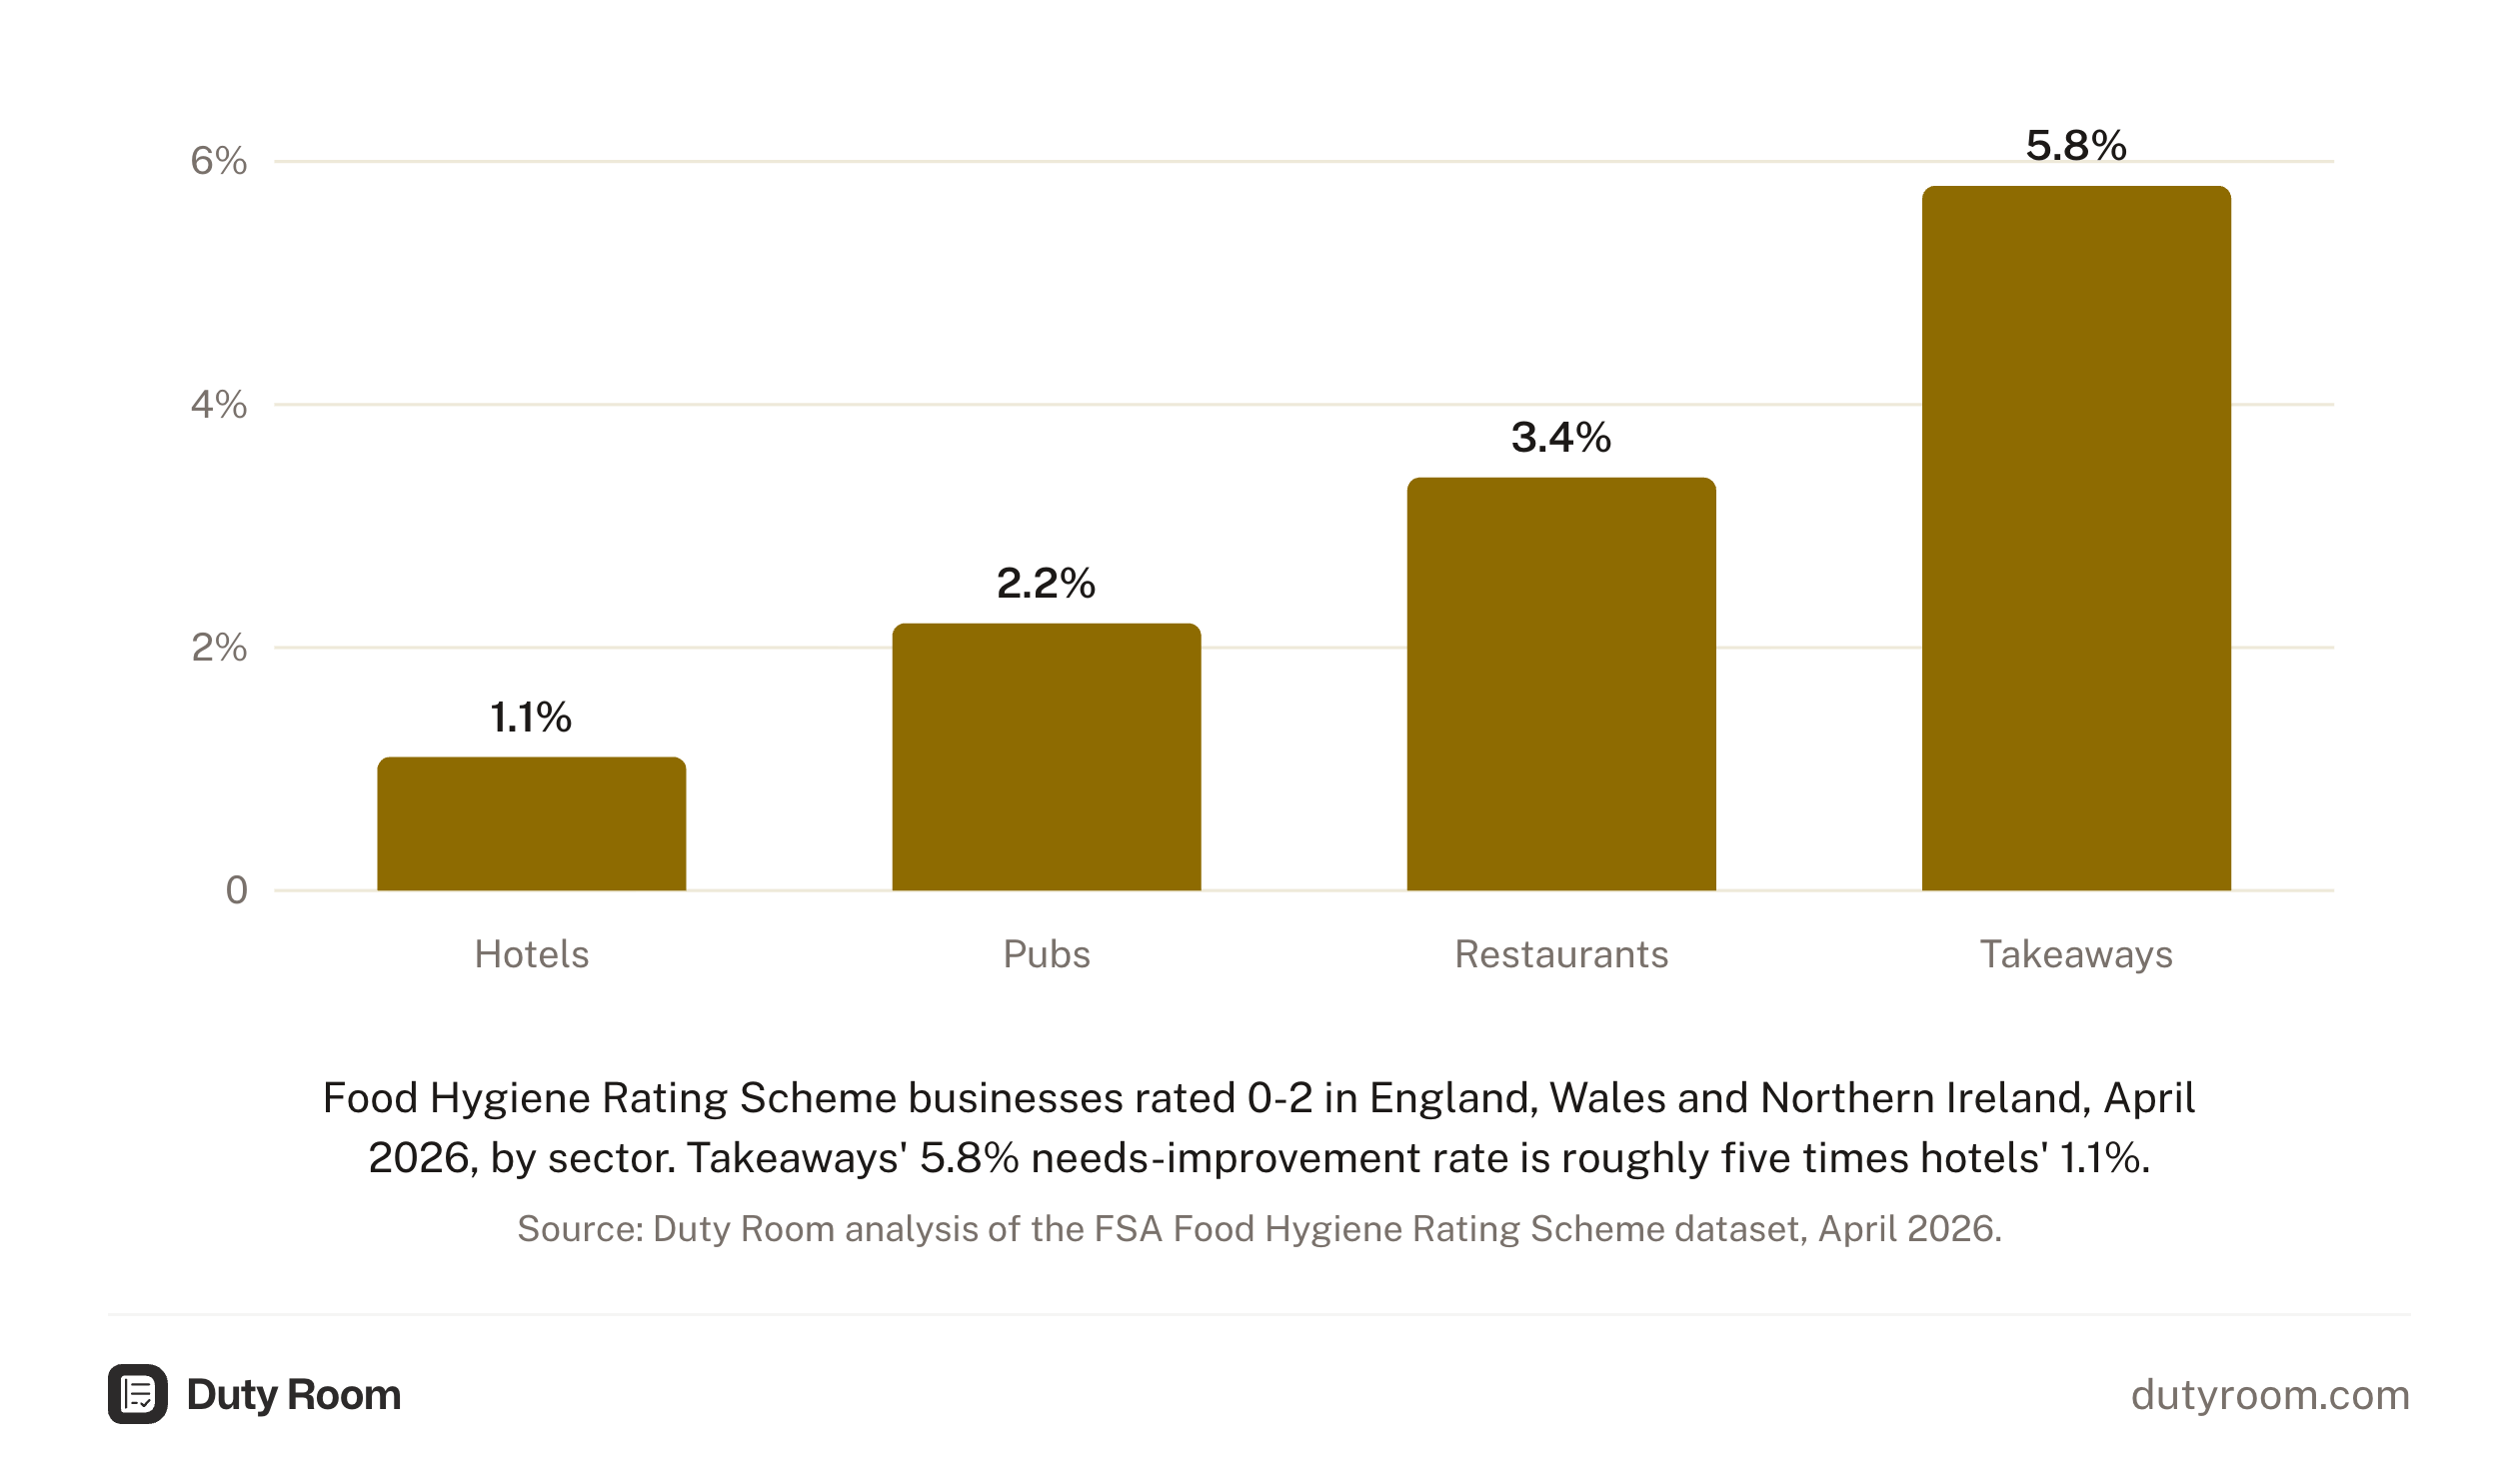
Hotels come out top. 85.1% of hotel food operations in the dataset hold a five-star rating. 1.1% need improvement. Needs improvement covers ratings of 0 to 2. Pubs sit lower: 76.7% at five stars, 2.2% needing improvement. Restaurants: 75.2% and 3.4%. Takeaways trail the field at 60.9% five-star and 5.8% needing improvement.
| Sector | Five-star | Needs improvement |
|---|---|---|
| Hotels | 85.1% | 1.1% |
| Pubs | 76.7% | 2.2% |
| Restaurants | 75.2% | 3.4% |
| Takeaways | 60.9% | 5.8% |
The gap between hotels and takeaways is more than 24 percentage points at the top and roughly five times the failure rate at the bottom.
The FSA's catch-all "other catering" category outscores all four named sectors, with 88.8% at five stars. It mixes event caterers, workplace canteens and mobile operators, so the sector comparison here sticks to the four premises-based trades.
The 560 zero-rated hospitality businesses at the time of the pull represent 0.2% of the rated file. Each one is a premises where an inspector recorded conditions the FSA scheme treats as urgent.
Component scores across the file
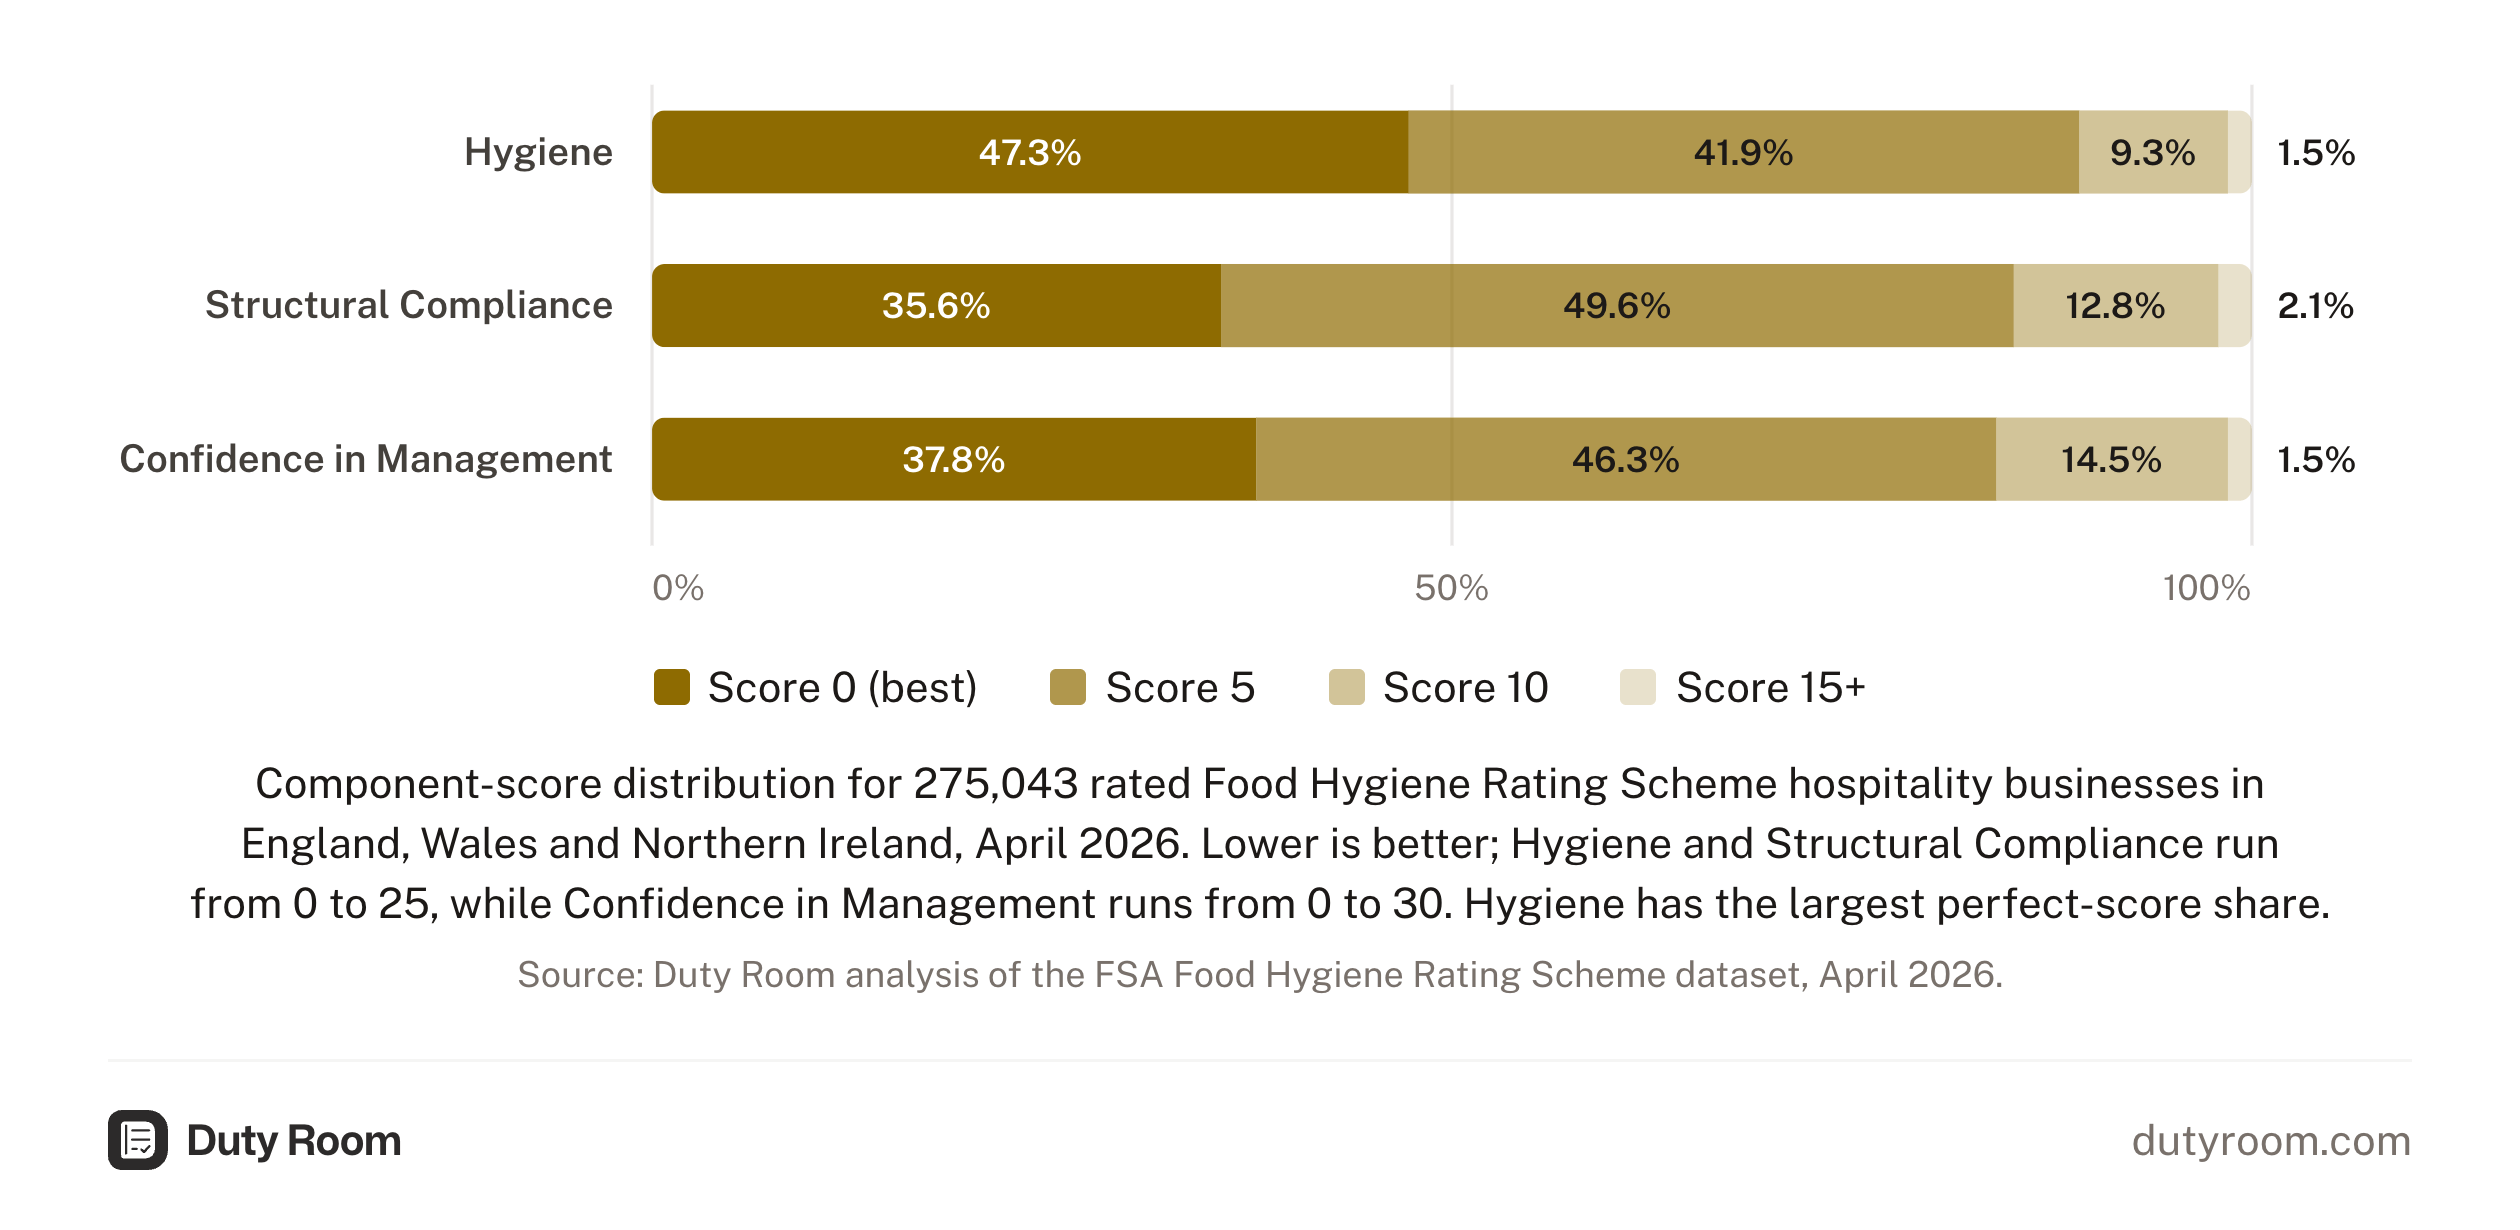
Lower scores are better. Hygiene has the strongest distribution: 47.3% of businesses score a perfect zero, while Structural Compliance and Confidence in Management carry larger shares at 10 or above. Average scores were 3.3 out of 25 for Hygiene, 4.1 out of 25 for Structural Compliance, and 4.1 out of 30 for Confidence in Management.
| Component | Score 0 (best) | Score 5 | Score 10 | Score 15 or more |
|---|---|---|---|---|
| Hygiene | 47.3% | 41.9% | 9.3% | 1.5% |
| Structural Compliance | 35.6% | 49.6% | 12.8% | 2.1% |
| Confidence in Management | 37.8% | 46.3% | 14.5% | 1.5% |
Why Confidence in Management matters more than the average suggests
Confidence in Management is the diagnostic score. It asks whether a business has the systems to stay compliant between visits rather than on the day the inspector happens to be in. The FSA describes it as covering the food safety management system, HACCP documentation, staff training, and track record.
The scoring matrix treats this component as a swing factor. The Brand Standard's matrix caps the rating on the weakest component score: a premises with perfect Hygiene and Structural scores and a 15 on Confidence in Management comes out at 2, though its total sits in the top band. The cap runs the other way too. A business that keeps every component at 10 or below still holds a 3 or 4 on a middling file, and a 5 requires nothing worse than a 5 anywhere. Documented control is what keeps the Confidence score inside those lines.
It is also the component closest to the prosecution file. Of the 88 food hygiene prosecutions Duty Room reviewed, 54 involved hospitality or premises-based businesses. Inadequate HACCP documentation was cited in roughly 38% of the full file. That documentation is the evidence base for Confidence in Management.
One Soho restaurant and its director were together ordered to pay £42,307 after an inspection found cockroaches, mice, and falsified food safety records.
The London gap
London runs above the national failure rate. 5.6% of hospitality businesses in the London data need improvement, against 2.7% for the rest of England. That is the largest regional gap in the file. It holds at five stars too: London's 66.2% five-star rate sits 12 percentage points below the rest of England's 77.9%. Wales, at 2.8% needing improvement, tracks the English rate outside the capital.
The dataset records the gap. It does not carry the variables that would explain it.
Enforcement patterns in the file
Local authorities reported 6,199 establishments subject to formal food hygiene enforcement action in 2024/25, 30% above pre-pandemic levels. The formal tools sit on a ladder: informal advice, written warnings, Hygiene Improvement Notices (with fixed deadlines), Hygiene Emergency Prohibition Notices (which close a business), and prosecution. Inspectors can skip the earlier steps in serious cases.
The backlog that built up during and after the pandemic stood at roughly 72,000 overdue interventions in October 2025, down from 95,000 a year earlier but still more than one and a half times the pre-pandemic count. An intervention is the Food Law Code's unit: a full inspection, a partial one, or an audit. Operators flagged by complaints, poor previous ratings, or outstanding re-inspection requirements move up the priority list. The backlog doesn't translate into operators being overlooked; it translates into prioritised lists.
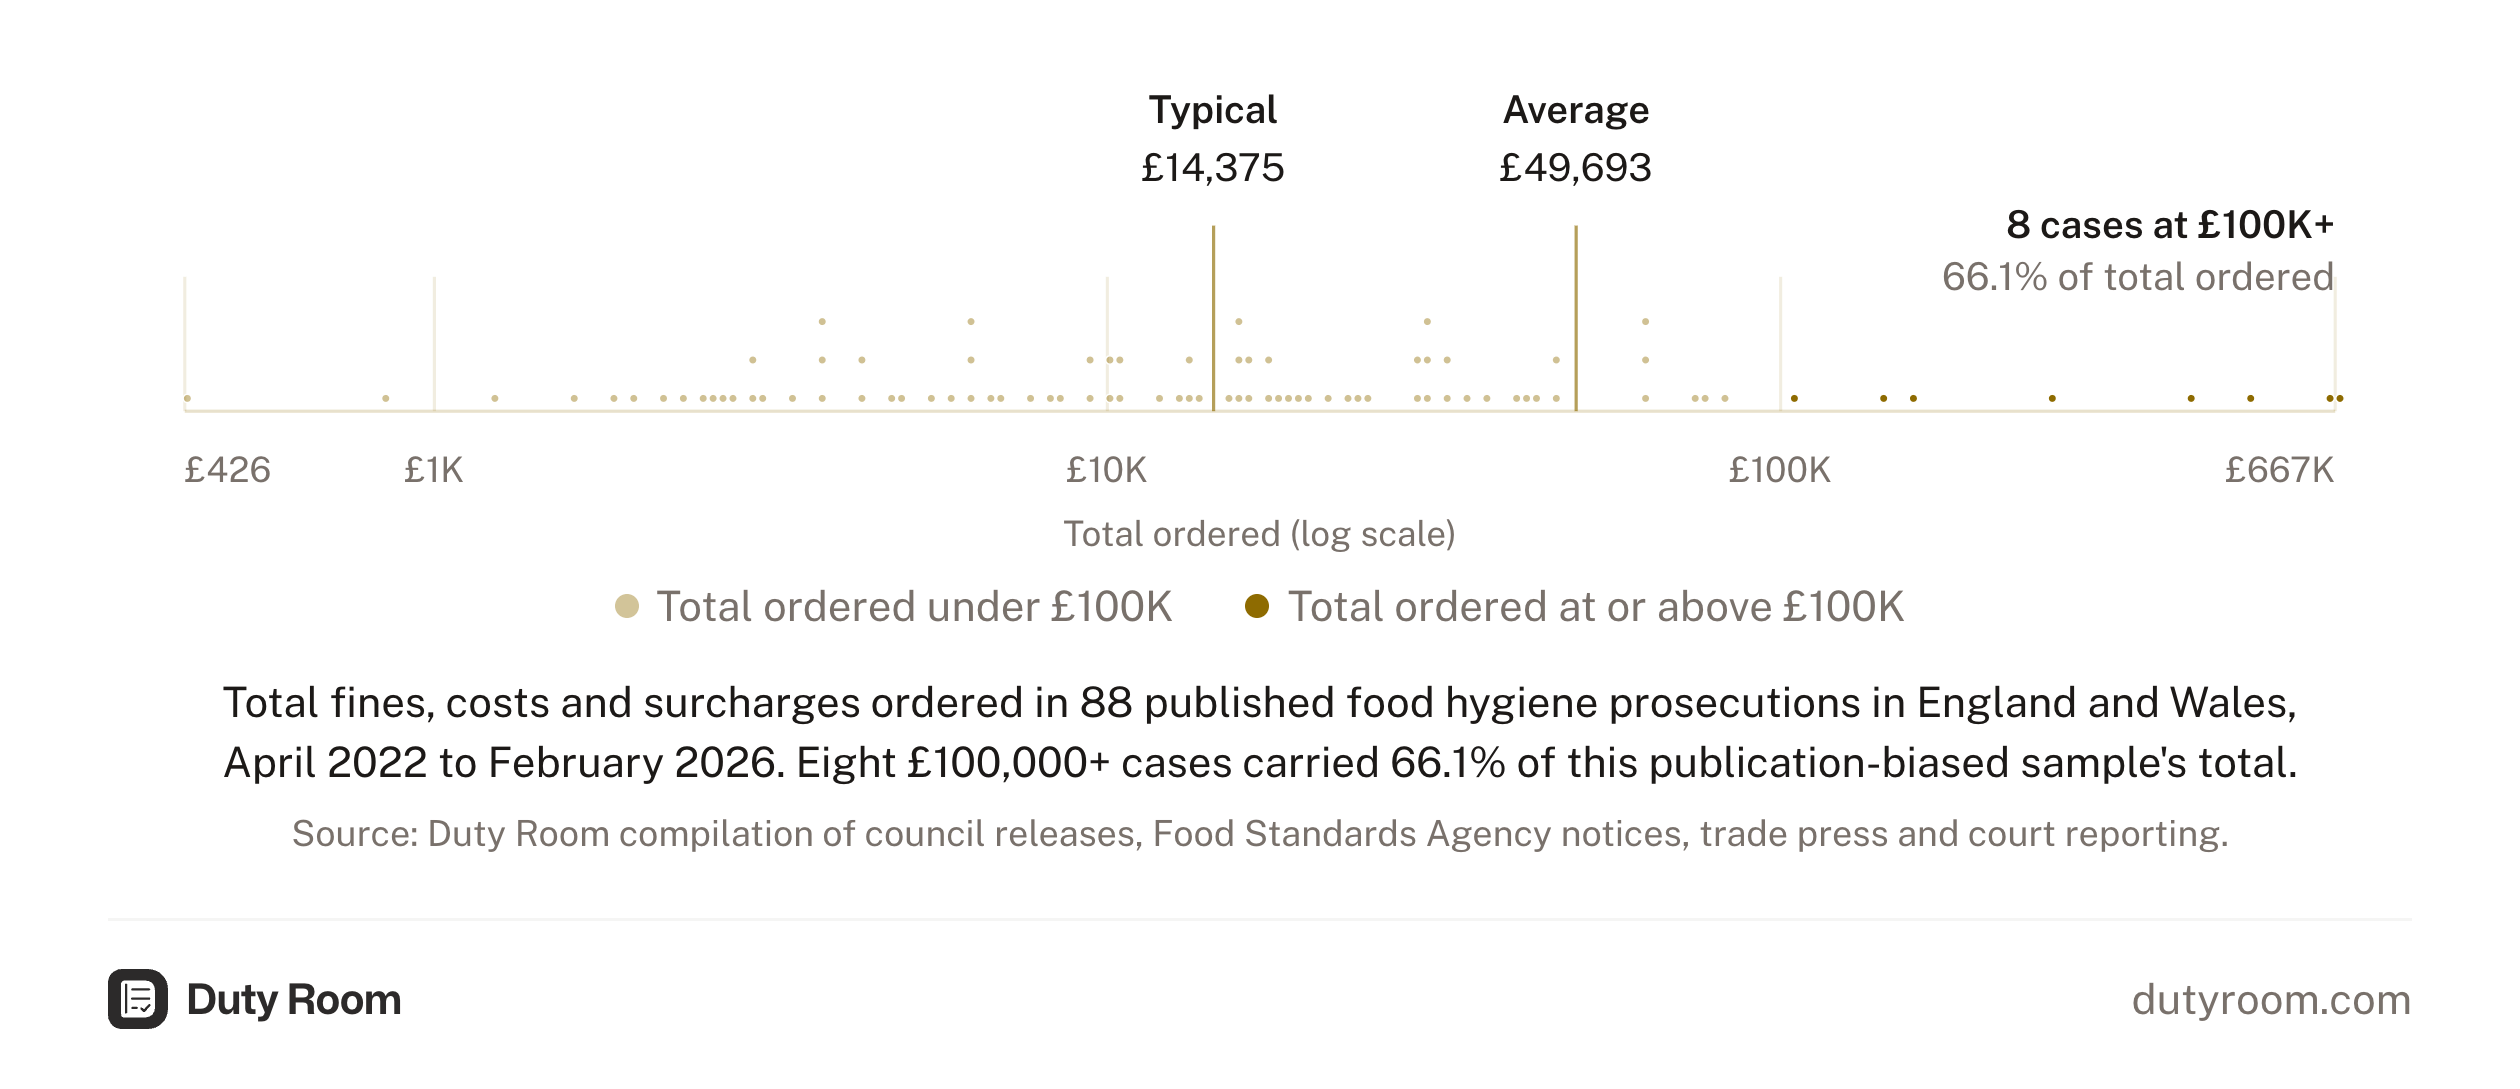
An illustrative file of 88 food hygiene prosecutions in England and Wales, covering court dates from April 2022 to February 2026, produced a typical (median) total ordered of £14,375 and an average of £49,693. Eight cases at £100,000 or more accounted for 66.1% of the file's total. Ministry of Justice court data for 2023 to 2025, analysed by Duty Room, shows an average fine of £13,959 across 428 organisation fine outcomes (the source's "02: Companies, public bodies, etc." category, England and Wales) for food hygiene offences. The Duty Room sample captures the fine, costs and surcharge, while the MoJ figures are the fine alone.
| Measure | Result |
|---|---|
| Typical total ordered (median) | £14,375 |
| Average total ordered (mean) | £49,693 |
| Cases at £100,000 or more | 8 of 88 (9.1%) |
| Share of the sample's total in those eight cases | 66.1% |
Two patterns recur in the prosecution file:
- Rodent infestation featured in roughly 75% of cases.
- Inadequate HACCP documentation featured in roughly 38% of cases, frequently alongside the rodent finding.
Examples from the file include a Dudley pub fined £20,000, with costs taking the bill to £23,408, for mouse infestation and out-of-date food, a Liverpool pub fined £22,000 (a £29,702 total bill) for mice, a Thame hotel that paid £29,243 after ignoring hygiene improvement notices, with dirty and damaged surfaces, poor waste storage, and missing food safety documentation, and a Suffolk pub ordered to pay £3,708, of which the fine was £498, in part because handwash basins were blocked and unusable.
Prosecution sector splits in the sample:
- Pubs, bars and hotels: 7 cases, typical penalty £10,000.
- Restaurants: 14 cases, typical penalty £24,940.
- Takeaways: the largest volume group in the file, with smaller individual penalties.
Severe allergen cases sit on a different track entirely. A cafe in Southwark was fined £18,000 with community service after an allergen failure connected to a child's death. The FSA's scoring guidance assesses allergen cross-contamination control under Hygiene and requires it to sit inside the food safety management system that Confidence in Management scores, but the legal and penalty regime around it runs separately.
Re-rating activity
Any business rated below 5 that accepts the rating can request a re-rating inspection once it has made the improvements the officer set out, ahead of the next planned visit. In Wales and Northern Ireland every local authority charges a fee for the visit and carries it out within three months of the written request. In England charging varies by council, and the rules follow the charging: where the authority charges, requests are unlimited and the visit should come within three months; where it is free, a business gets one re-rating between planned inspections, and a request made within three months of the original inspection can wait up to six months from that inspection.
Several major delivery platforms set minimum FHRS thresholds for listed businesses, and re-rating activity in FSA-cited figures has tracked alongside platform listing pressure rather than enforcement alone.
The mandatory display position differs across the four nations. Wales and Northern Ireland require display of the rating at premises, and failure to display is an offence. England's scheme remains voluntary. Making the scheme statutory in England is an explicit objective of the FSA's Future of Food Regulation programme, endorsed by its Board in March 2026; no legislation has yet been made. The FSA publishes all ratings on its public site regardless, so the rating is discoverable whether a sticker is in the window or not.
Data limitations
A few caveats shape how the numbers in this report should be read.
The FHRS file is a snapshot. Ratings in the dataset reflect the most recent inspection for each business, which can be anywhere from a few months to a few years old depending on the risk category. Category A premises are inspected at least every six months. Category E, the lowest risk, may wait up to three years. A business that has improved since its last visit still shows the previous score until a new inspection or a re-rating is complete.
Scotland's separate scheme uses different categories ("Pass," "Improvement Required") and is not directly comparable, so Scottish businesses are excluded from every number in this report.
Sector classification relies on the FSA's business type taxonomy. A venue that operates as both a pub and a restaurant may be classified under either depending on the authority. The sector comparisons in this report are therefore directional rather than precise, though the gap between hotels and takeaways is large enough that classification drift doesn't close it.
The 88-case prosecution sample was compiled from council press releases, trade press and court reporting, covering court dates from 2022 to early 2026, and is not a complete list of food hygiene prosecutions in that period. It's an illustrative file, not a census. Ministry of Justice court data on food hygiene offences provides the fuller national picture on fine distributions and is cited separately above.
Component-score statistics were calculated across the 275,043 rated hospitality businesses in the FHRS file; awaiting-inspection businesses and Scotland are excluded. Sector statistics use the FSA's published business-type tags. Rating distributions use the most recent rating for each business, with rated businesses as the denominator. The five-star and needs-improvement shares in the sector table don't sum to 100 because ratings of 3 and 4 sit between them.
The composite picture
Hospitality food businesses in England, Wales and Northern Ireland score better on Hygiene than on the two components that measure physical condition and documented control. Hotels outperform takeaways by a wide margin. London runs above the failure rate elsewhere in England. The 88-case prosecution sample is concentrated on rodent infestation and inadequate HACCP documentation.
The scoring matrix is structured so that Confidence in Management can constrain the final rating when its score is high. The HACCP-documentation failure cited in 38% of the prosecution sample is the documentary evidence that component scores against.
For more on where food hygiene prosecutions sit within the enforcement ladder, see the Duty Room briefing on food safety enforcement.
This report is based on published enforcement data, sources available at publication, and original analysis. It is for general information only and doesn't constitute legal advice.
The rating on your door starts with your records.
Organisation food hygiene fines in England and Wales average £13,959, nearly double the £7,100 figure from the Sentencing Council's 2019 assessment. Duty Room keeps temperature, SFBB, and allergen records current.