Most Visits Stop Short
How Often Does Fraser Health Issue Violation Tickets?
Fraser Health publishes a single PDF of food safety violation tickets. It covers the past thirteen months, updates periodically, and overwrites the previous version. If you don't download it before it refreshes, the old data is gone.
We have it anyway, six years of it: 125 unique violation tickets spanning October 2019 to January 2026.1 As far as we can tell, it is the most complete longitudinal record of Fraser Health food safety enforcement outside the authority itself.
About Twenty Tickets a Year, Every Year
The enforcement rate is steady. Strip out one Hope restaurant outlier (more on that below) and Fraser Health issues roughly 18 to 22 food safety violation tickets per year. That rate held before COVID, dipped during lockdowns, and returned to baseline afterward. There is no upward or downward trend; the health authority tickets at a consistent pace.
| Year | Tickets | Total fines | Notes |
|---|---|---|---|
| 2019 | 24 | $6,785 | Oct-Dec only |
| 2020 | 22 | $6,670 | COVID-19 dip visible in Q2-Q4 |
| 2021 | 30 | $9,315 | Includes 12 tickets from one Hope restaurant |
| 2022 | 8 | $2,415 | Jan-May only, then data gap |
| 2024 | 18 | $4,830 | From Nov 2023 snapshot |
| 2025 | 22 | $6,095 | Feb-Dec; Jan falls in a snapshot gap |
| 2026 | 1 | $345 | Jan only |
The COVID dip is visible but modest. Q2 through Q4 of 2020 produced only 11 tickets across nine months, about a quarter below the usual pace. Inspections likely slowed during public health orders. By 2021, volume had recovered and then some, though the 2021 spike is almost entirely explained by one restaurant in Hope that refused to close.
A gap in the record runs from May 2022 to November 2023. No snapshots survive for those eighteen months. Based on the rate in adjacent periods, somewhere between 25 and 35 tickets are missing from this data. The true total since 2019 is likely 150 to 160.
Two Fine Amounts Cover 94% of All Tickets
Fraser Health doesn't set fine amounts. They come from BC Reg. 89/97, the Violation Ticket Administration and Fines Regulation, and there are only two amounts that matter.
| Amount | Count | Share | Typical violations |
|---|---|---|---|
| $230 | 53 | 42% | Sanitation, training, handwashing |
| $345 | 64 | 51% | Food contamination, unsafe temperatures, defying orders |
The remaining 6% sit outside the two standard amounts: a handful of $115 tickets for offences like obstruction and giving false information, two $460 tickets combining two offences, and a single $690 ticket for a pub in Maple Ridge, the highest in the data.
The two-tier structure means there's no discretion in the amount. An inspector doesn't decide how much to fine you; the offence determines the price. A handwashing failure is $230. Operating in defiance of a closure order is $345.
This is different from Ontario, where court-prosecuted food safety cases can run into the thousands. BC's fixed-ticket system produces smaller individual amounts but more predictable enforcement. You know exactly what a violation will cost before an inspector walks through the door.
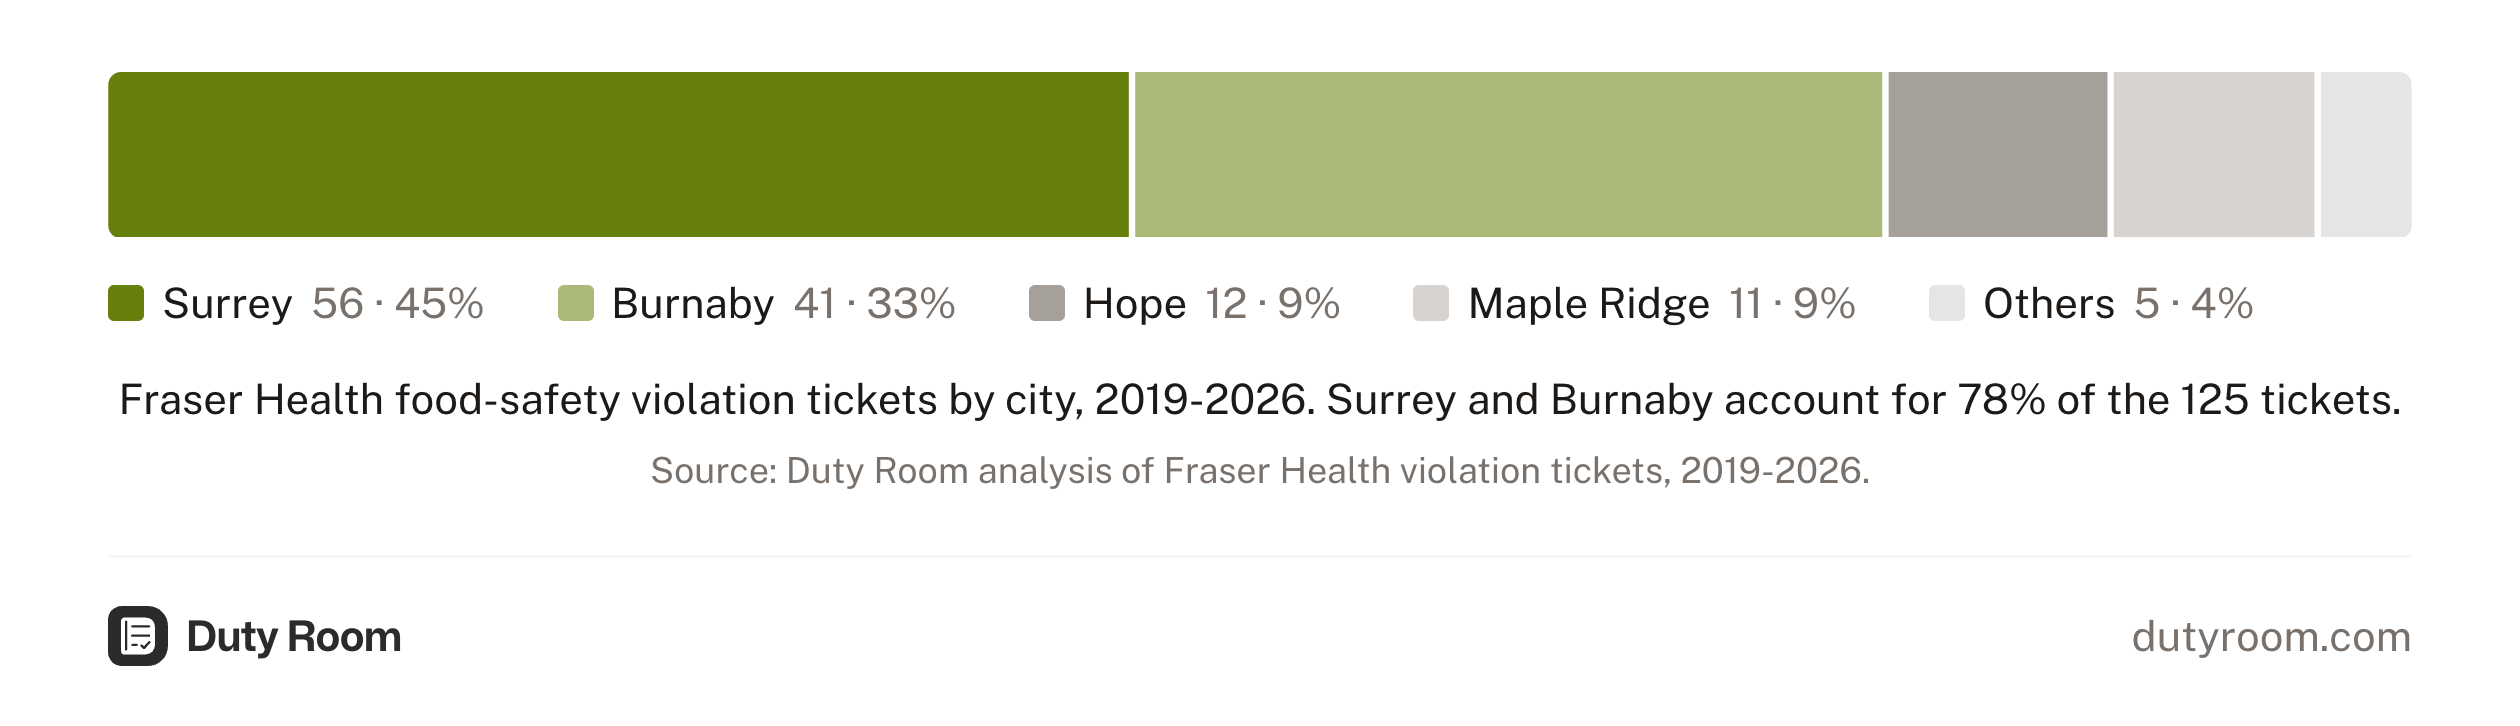
Surrey and Burnaby: More Than Three-Quarters of All Tickets
| City | Tickets | Share | Total fines |
|---|---|---|---|
| Surrey | 56 | 45% | $15,065 |
| Burnaby | 41 | 33% | $11,730 |
| Hope | 12 | 10% | $4,140 |
| Maple Ridge | 11 | 9% | $3,910 |
| Chilliwack | 3 | 2% | $1,035 |
| Langley | 1 | 1% | $345 |
| New Westminster | 1 | 1% | $230 |
| City | Tickets | Share | Total fines |
|---|---|---|---|
| Surrey | 56 | 45% | $15,065 |
| Burnaby | 41 | 33% | $11,730 |
| Hope | 12 | 10% | $4,140 |
| Maple Ridge | 11 | 9% | $3,910 |
| Chilliwack | 3 | 2% | $1,035 |
| Langley | 1 | 1% | $345 |
| New Westminster | 1 | 1% | $230 |
Surrey and Burnaby together account for 78% of all violation tickets2. That tracks with population and food establishment density. These are the largest cities in the Fraser Health region, with the most restaurants, the most inspections, and accordingly the most tickets.
Hope's 10% share is entirely one business. Without that restaurant, Hope would have zero tickets in the data. Maple Ridge's 9% is more distributed across establishments and represents a genuine local enforcement pattern.
Notably absent: Abbotsford, Mission, White Rock, and the Tri-Cities (Coquitlam, Port Coquitlam, Port Moody) produced no violation tickets across six years of data. That doesn't mean those cities have perfect compliance. It means either their violations stayed below the ticket threshold or they fall outside the coverage captured in these PDFs.
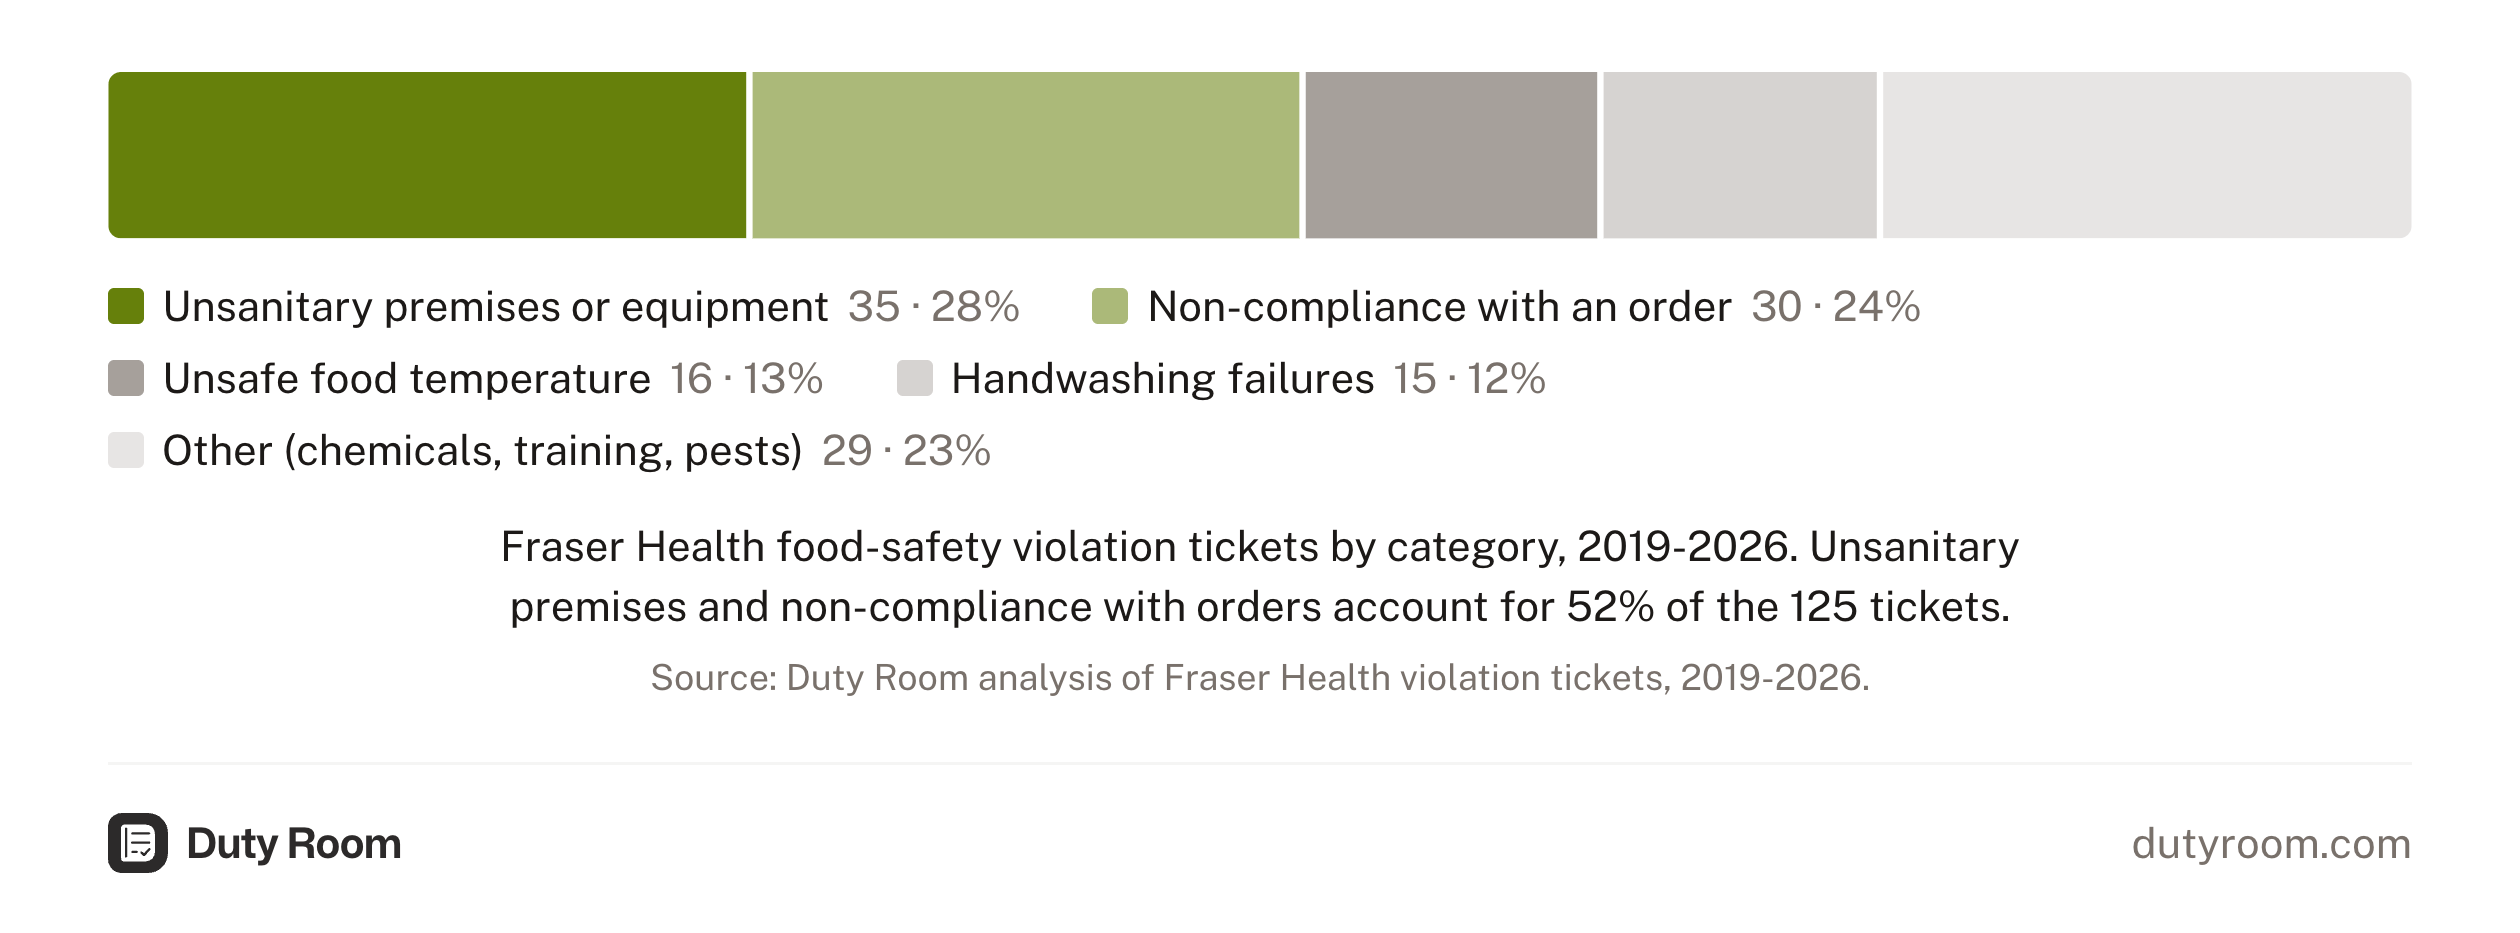
What Gets You Ticketed
| Category | Tickets | Share |
|---|---|---|
| Unsanitary premises or equipment | 35 | 28% |
| Non-compliance with a health authority order | 30 | 24% |
| Unsafe food temperature | 16 | 13% |
| Handwashing failures | 15 | 12% |
| Other (chemicals, training, pests) | 29 | 23% |
| Category | Count | Share |
|---|---|---|
| Unsanitary premises or equipment | 35 | 28% |
| Non-compliance with a health authority order | 30 | 24% |
| Unsafe food temperature | 16 | 13% |
| Handwashing failures | 15 | 12% |
| Other (chemicals, training, pests) | 29 | 23% |
The two biggest categories sit at 28% and 24%. Unsanitary premises covers the physical state of your kitchen: dirty equipment, contaminated surfaces, pest evidence. Non-compliance with orders means an inspector already told you to fix something and you didn't. The second category is worse. Those tickets are $345 each under Public Health Act s.99(1)(k), and they signal a business that has already been warned.
Handwashing failures are typically $230 tickets. Unsafe food temperature is a $345 ticket.
The practical takeaway: keep your premises clean, and when an inspector gives you an order, act on it. More than half the tickets in this data come down to those two things.
One Restaurant, Twelve Tickets: What Happens When You Ignore a Closure Order
Between September 17 and October 19, 2021, a restaurant in Hope received 12 violation tickets totalling $4,140. Every ticket was for the same offence: operating a food premises in defiance of a health authority closure order, at $345 each.
That's 10% of all tickets in six years of data, from one restaurant in one month.
The record shows one ticket on September 17, then a near-daily run of eleven between October 8 and October 19. Each day the restaurant opened was a new $345 ticket. The closure order didn't change. The fine amount didn't escalate. The tickets just accumulated. After 12 tickets in 33 days, the record shows no further tickets from the restaurant, though the data can't confirm whether the restaurant ultimately closed voluntarily, was shut down by other means, or simply rolled off the next PDF window.
The Hope restaurant case distorts the 2021 numbers and inflates Hope's geographic share, but the case is instructive. It shows the ceiling of what ticket enforcement looks like when an operator simply refuses to comply. The fines stack linearly: $345 per day, every day, with no cap visible in the data.
Other Cases Worth Knowing
A Burnaby seafood shop received three tickets on a single day, October 31, 2019, totalling $575. One was for providing false information to inspectors ($115), another for obstructing an official ($115), and the third for non-compliance ($345). It's the only case in the data involving obstruction or deception charges. Every other ticket in the data is for the state of premises or practices, not for interference with inspectors.
A Burnaby grocery chain received three tickets across consecutive days in late April 2022: food contamination, unsafe temperature, and inadequate handwashing. The three tickets totalled $920.
A Maple Ridge pub holds the single highest ticket in the data: $690 for two offences combined on one ticket (unsafe food temperature and inadequate refrigeration equipment). Most operators see $230 or $345. Seeing $690 means the inspector found two ticketable offences in the same visit and charged them together.
What the Ticket Record Doesn't Show
These 125 tickets represent the floor of enforcement, not the ceiling. The PDF only includes tickets with confirmed guilty statuses as reported by ICBC3. Tickets that were disputed and overturned, or still pending adjudication, don't appear. Neither do warnings, re-inspections, or closure orders that didn't result in a ticket.
The eighteen-month gap (May 2022 to November 2023) means the data is incomplete. Any analysis of annual trends carries that caveat.
As of a March 2026 survey of the five health authority portals, Fraser Health is the only BC health authority that publishes violation tickets with dollar amounts. Vancouver Coastal Health publishes restaurant closure lists. Island Health has inspection records going back to 2005 for its North and Central Island service areas. But none of them publish what Fraser Health does: the names, the amounts, and the offences, all in one document. That transparency, even in its limited rolling-window form, is what made this analysis possible.
For operators in the Fraser Health region, the message from six years of ticket data is consistent. Enforcement runs at a steady 18 to 22 tickets per year. The fines are fixed and modest ($230 or $345). The violations that trigger them are preventable: clean premises, safe temperatures, proper handwashing, and acting on inspector orders when they come.
-
Duty Room analysis of 125 unique violation tickets compiled from nine versions of the Fraser Health violation-ticket PDF, six of them recovered from the Wayback Machine, deduplicated across overlapping windows (130 raw rows to 125 unique), October 2019 to January 2026.
-
Duty Room analysis of the Fraser Health violation tickets: Surrey (56) and Burnaby (41) account for 97 of the 125, 78% of the total.
-
Fraser Health's published PDF states these are "only violation tickets with confirmed guilty statuses as reported to Fraser Health by the Insurance Corporation of British Columbia."
This report is based on published enforcement data, sources available at publication, and original analysis. It is for general information only and doesn't constitute legal advice.
The records the inspector looks for, tracked per site
Duty Room helps BC operators keep temperature logs, FoodSafe certificates, cleaning records, and corrective actions current and shared across sites.