Same Injuries, Different Year
23 Years of Hospitality Injuries in BC
Falls account for 24.5% of all hospitality injuries in BC. They accounted for roughly the same share in 2001. Twenty-three years of safety training, wet-floor signs, and non-slip shoe programs have not budged this number. It has sat between 22% and 26% every single year the BC Injury Research and Prevention Unit has tracked it.
The BCIRPU Injury Data Online Tool tracks every accepted WorkSafeBC time-loss claim by year, cause, injury type, and body part across hotels, restaurants, pubs, bars, catering operations, and leisure venues. The data runs from 2001 to 2023.
Over that period: 118,705 time-loss claims. In 2023 alone, 5,053 workers were injured seriously enough for a doctor to pull them off the schedule and WorkSafeBC to start paying. That works out to roughly one every 100 minutes, all year1.
Falls: the problem that won't respond to training
Same-level falls produced 843 claims in 2023 (16.7% of all injuries). Falls from elevation added another 397 (7.9%). Combined, that is 1,240 time-loss claims. The elevation falls are actually up 4% since 2001, even as total claims dropped 22%.
The surfaces where people fall are the same ones they fell on in 2001: wet kitchen floors, uneven mats, icy loading docks, stairs with worn treads. The proportion hasn't budged after two decades of safety training modules that every new hire clicks through during orientation. Whatever combination of environment, behaviour, and training is producing falls, the interventions applied so far haven't been enough to shift the aggregate number, and the fixes left are engineered ones: drainage, matting, lighting, tread maintenance. Training alone doesn't move this category. WorkSafeBC issued 152 administrative penalties for inadequate fall protection in 2024, totalling just over $1 million.
Concussions quadrupled
In 2001, WorkSafeBC accepted 79 concussion claims from hospitality workers. By 2023: 314. Four times as many, during a period when total claims dropped 22%. That is a fourfold divergence from every other trend in the data.
The growth wasn't gradual. It accelerated sharply around 2012, aligning with the broader concussion recognition movement. Average annual concussions ran at roughly 79 from 2001-2003, climbed to about 110 from 2004-2008, then jumped to 213 from 2012-2013 and peaked at 369 in 2017. The 2012 inflection point almost certainly reflects better diagnosis and reporting rather than workplaces suddenly becoming more dangerous.
Improved diagnosis doesn't make the injuries less real. The causes in hospitality are specific: slipping on a wet floor and hitting your head on equipment, walking into low-hanging shelving, getting struck by a falling object in a crowded kitchen. In pubs and bars, go2HR's alcohol service injury profile reports that falls cause 25% and violence causes 17% of front-of-house incidents. Both are concussion vectors. Workers who took a knock in 2005 and were told to walk it off now get assessed and put on a claim.
Where the fixes worked
Back strain produced 1,259 time-loss claims in 2001 (19.5% of all injuries). By 2023: 655 claims (13.0%). A 48% decline2, and the single largest absolute reduction in any injury type over the 23-year data. 604 fewer workers per year going home with a wrecked back.
WorkSafeBC and go2HR have run musculoskeletal injury prevention programs for decades: ergonomic training, lift-assist equipment, workstation redesign, proper shelving heights. The decline is consistent with those programs working. Twenty-three years of steady improvement, across a workforce that turned over many times, is about as close as observational data gets to showing that targeted prevention works when the intervention matches the hazard.
The overexertion numbers tell the same story from a different angle. Overexertion was the number-one cause of hospitality injuries in 2001 at 1,312 claims (20.3% of all injuries). By 2023 it had dropped to 881 (17.4%), a 33% decline. Around 2014-2015, "struck by" overtook overexertion as the leading cause for the first time. That reversal has held for nearly a decade. Ergonomic interventions worked on the injuries they were designed to prevent.
Hands tell the equipment side of the same story. Wrist, finger, and hand injuries remain the largest body-part category: 1,445 claims in 2023, or 28.6% of all injuries. Nearly double the next category (back, at 13.9%). The number is down 31% from the 2,081 hand injuries in 2001, and cut-resistant gloves and improved kitchen equipment have likely helped. Lacerations specifically fell 26% (from 1,281 to 950). Exposure-to-heat-and-cold claims, mostly burns, dropped 36% over the same period (from 606 to 387), consistent with the adoption of better oven mitts, splash guards, induction cooktops, and temperature-controlled fryers.
In a sector of knives, mandolines, hot surfaces, and wet glassware, hands will always be the primary target. But the declines align with equipment and PPE interventions working when operators actually implement them, and equipment investments pay off in fewer claims and fewer shifts spent short-staffed while someone heals.
The remaining problem is objects hitting workers in tight, cluttered spaces. The data points to kitchen layout, equipment placement, and traffic flow for the next round of reductions.
The 2009 step-change
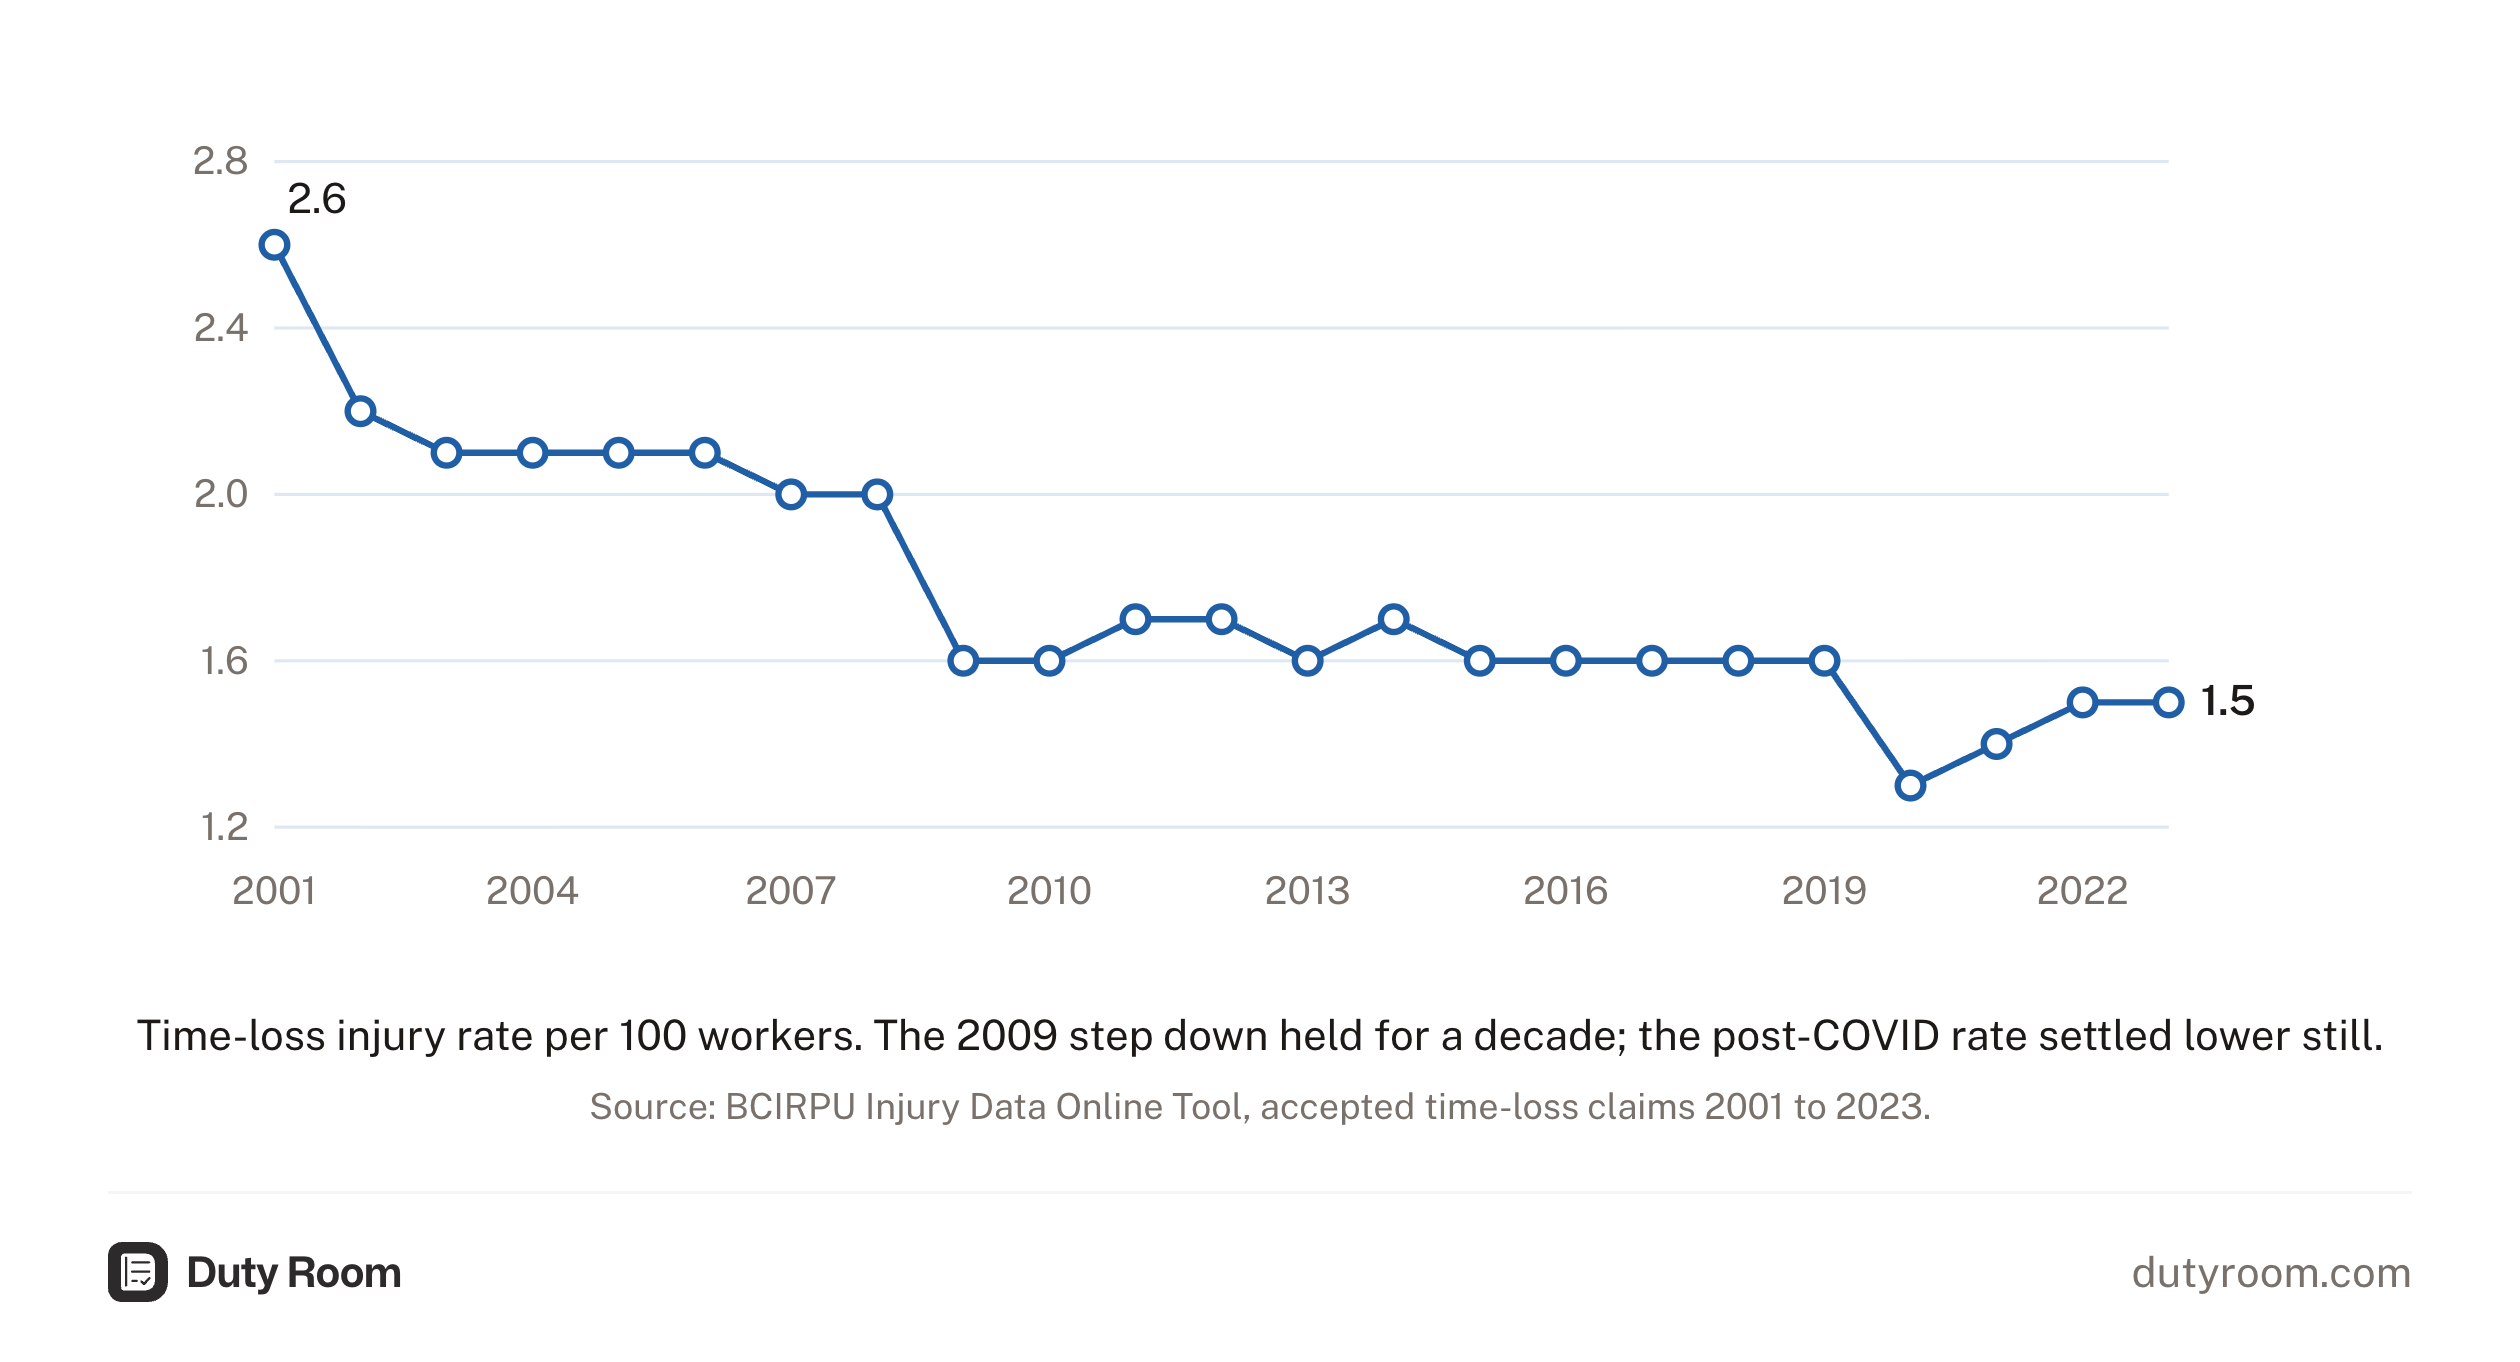
The 23-year data has one structural break that dwarfs everything else. In 2009, claims dropped 17% in a single year (5,806 to 4,791). The injury rate fell from 2.0 to 1.6 per 100 workers and never came back, not when the economy recovered, not when the workforce grew past pre-recession levels, and not in the decade that followed.
| Year | Claims | Rate per 100 | Implied workforce |
|---|---|---|---|
| 2001 | 6,462 | 2.6 | 248,500 |
| 2002 | 5,534 | 2.2 | 251,500 |
| 2003 | 5,268 | 2.1 | 250,900 |
| 2004 | 5,519 | 2.1 | 262,800 |
| 2005 | 5,399 | 2.1 | 257,100 |
| 2006 | 5,609 | 2.1 | 267,100 |
| 2007 | 5,740 | 2.0 | 287,000 |
| 2008 | 5,806 | 2.0 | 290,300 |
| 2009 | 4,791 | 1.6 | 299,400 |
| 2010 | 4,797 | 1.6 | 299,800 |
| 2011 | 4,978 | 1.7 | 292,800 |
| 2012 | 5,070 | 1.7 | 298,200 |
| 2013 | 4,789 | 1.6 | 299,300 |
| 2014 | 5,092 | 1.7 | 299,500 |
| 2015 | 5,148 | 1.6 | 321,800 |
| 2016 | 5,115 | 1.6 | 319,700 |
| 2017 | 5,287 | 1.6 | 330,400 |
| 2018 | 5,491 | 1.6 | 343,200 |
| 2019 | 5,603 | 1.6 | 350,200 |
| 2020 | 3,615 | 1.3 | 278,100 |
| 2021 | 3,806 | 1.4 | 271,900 |
| 2022 | 4,733 | 1.5 | 315,500 |
| 2023 | 5,053 | 1.5 | 336,900 |
Before 2009, claims averaged 5,542 per year with rates ranging from 2.0 to 2.6 per 100 workers. The timing suggests the financial crisis, not a safety initiative, as a likely factor. Recessions force closures, and the businesses that close first tend to be the ones with the worst equipment and the fewest safety controls. The workforce recomposes. Surviving businesses use downtime to upgrade and retrain. That's one plausible explanation, not the only one, and there may be overlapping causes the data can't isolate3.
Whatever caused the 2009 drop, it stuck. The rate held at 1.6 through a decade of sustained industry growth, during which the workforce expanded 17% (from 299,400 to 350,200 implied full-time equivalents) while claims barely budged. More workers, roughly the same number of injuries. The same pattern may be playing out post-COVID, with the rate sitting at 1.5 rather than returning to the pre-pandemic baseline. By 2023, claims reached 90% of 2019 levels, but the rate remains lower. Whether that reflects genuine improvement or incomplete workforce recovery remains unsettled.
Fewer injuries, but worse ones
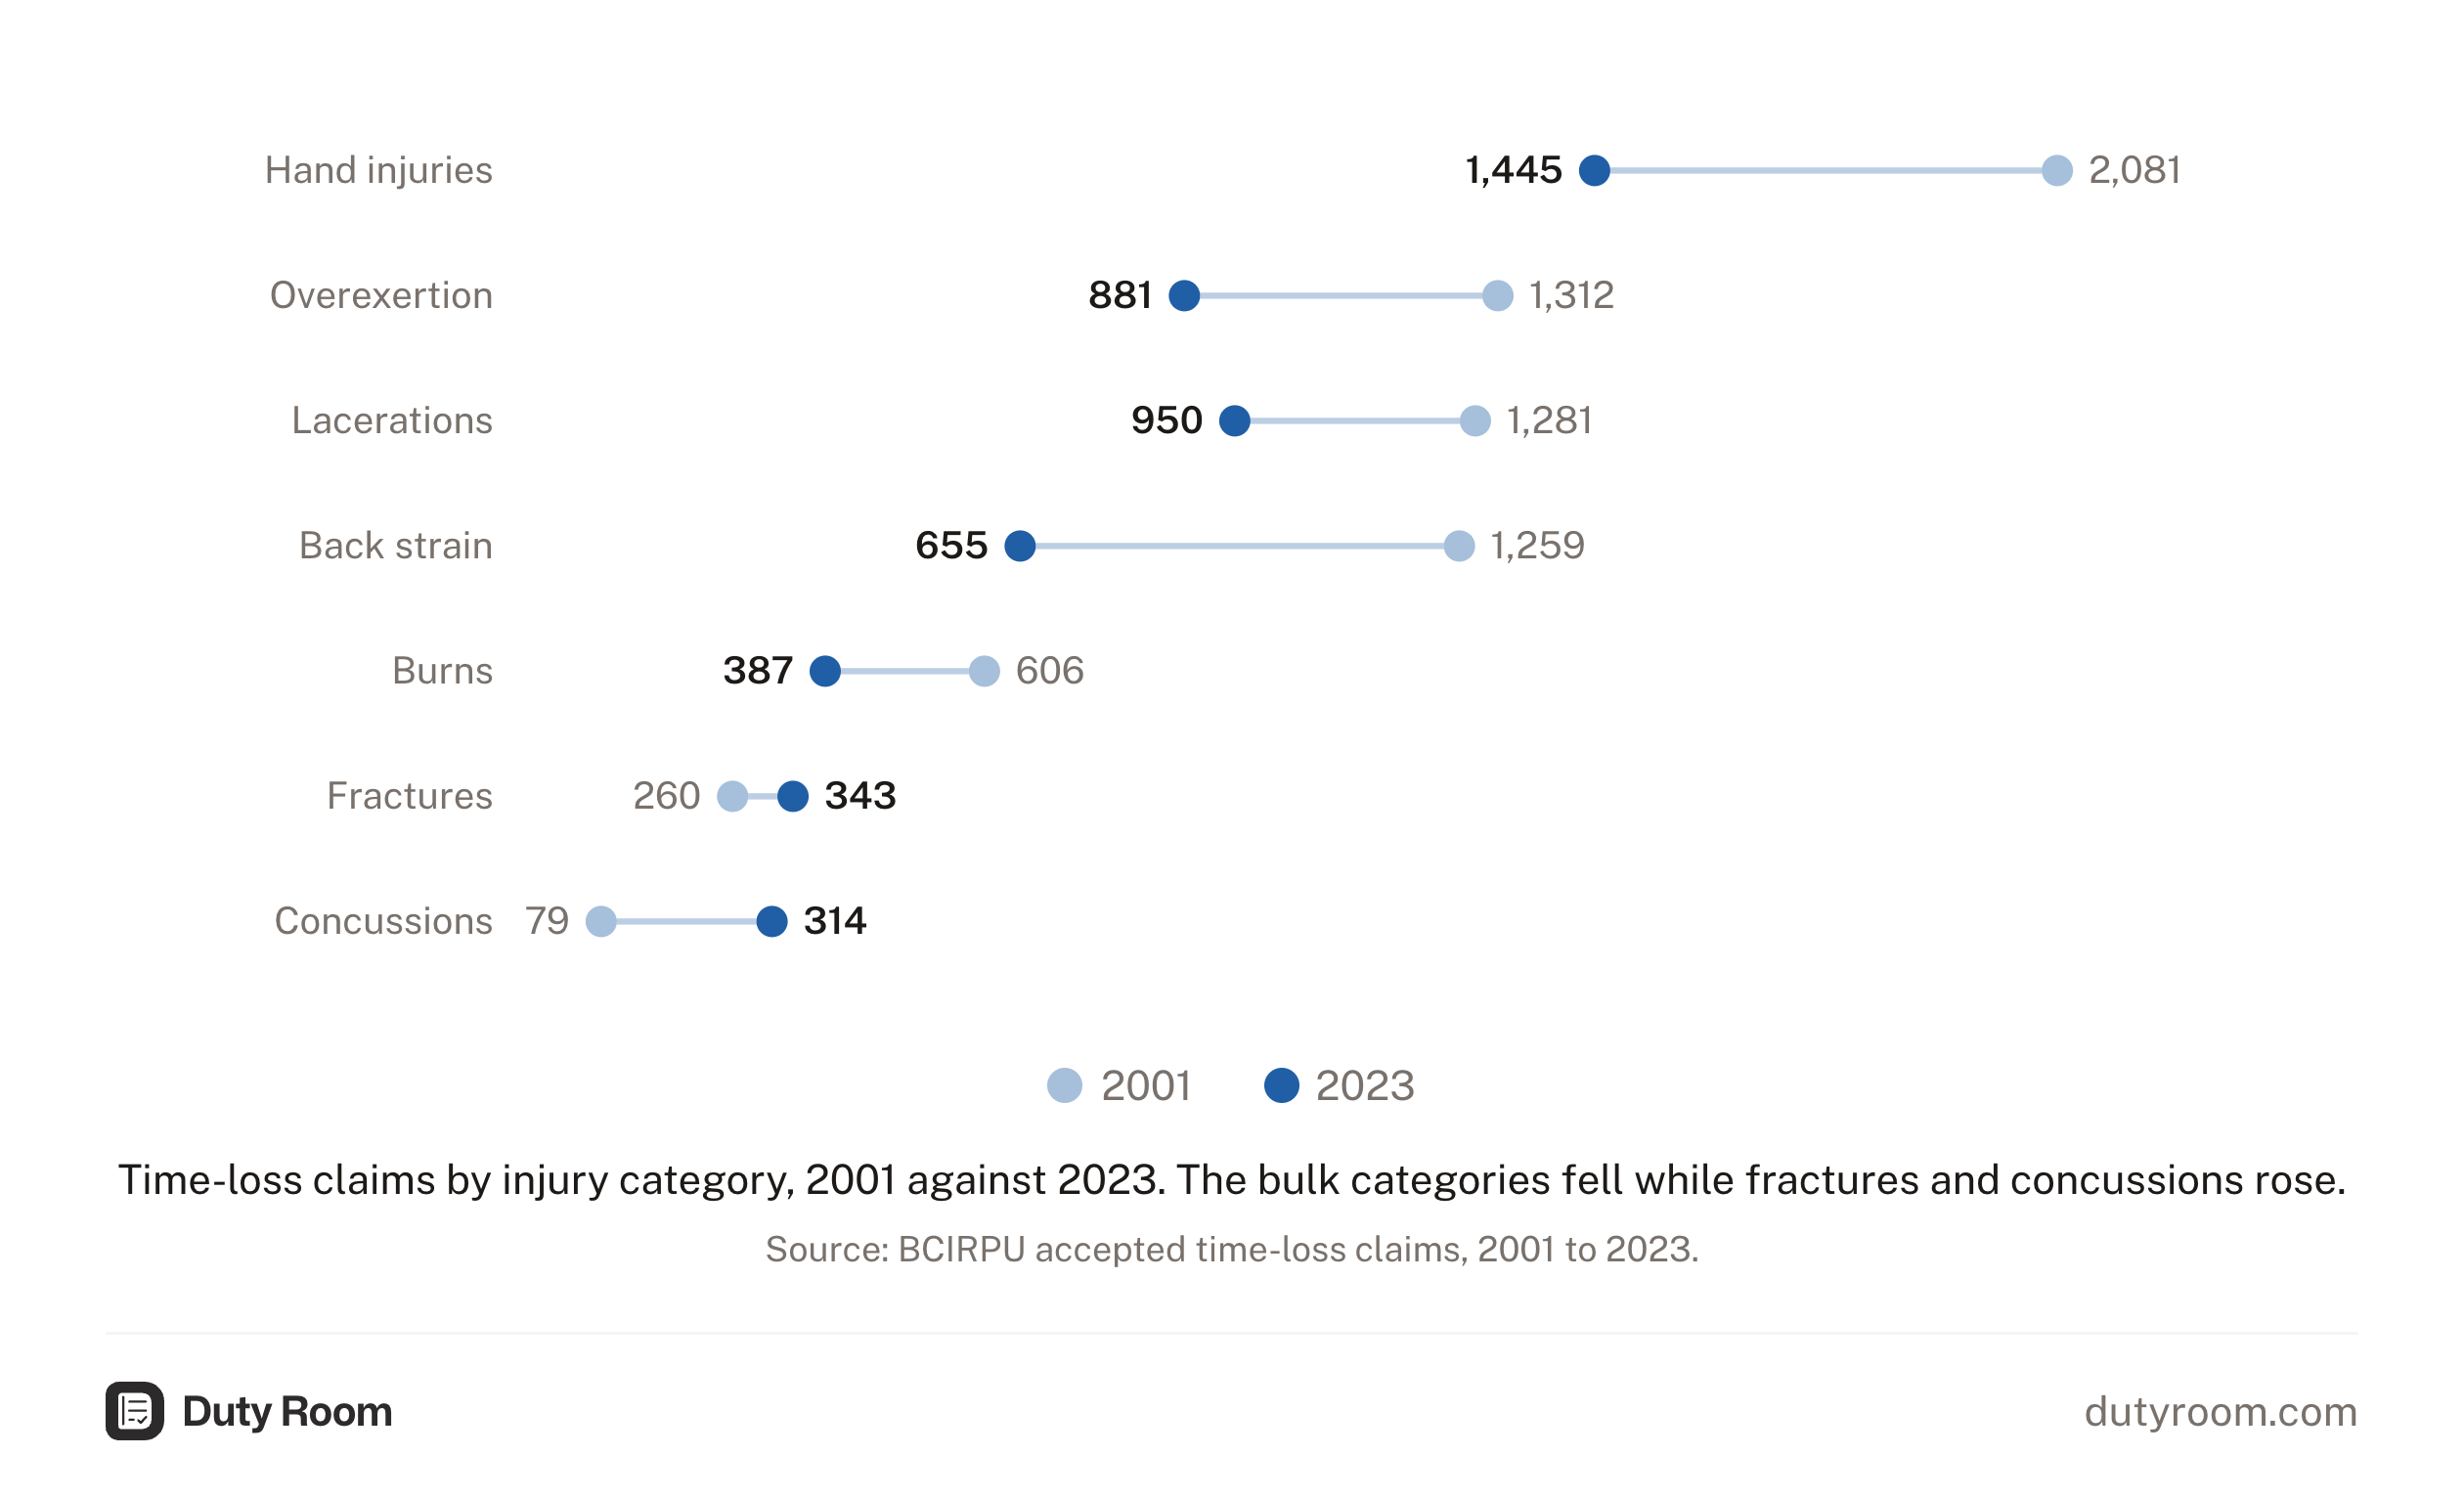
Total claims are down 22% since 2001. The injury rate per 100 workers has fallen 42%, from 2.6 to 1.54. By those measures, hospitality is significantly safer. But while total claims fell, fractures rose 32% (from 260 to 343 per year) and concussions rose 297%. The share of claims that are fractures nearly doubled, from 4.0% to 6.8%.
| Category | 2001 claims | 2023 claims |
|---|---|---|
| Hand injuries | 2,081 | 1,445 |
| Overexertion | 1,312 | 881 |
| Lacerations | 1,281 | 950 |
| Back strain | 1,259 | 655 |
| Burns | 606 | 387 |
| Fractures | 260 | 343 |
| Concussions | 79 | 314 |
The injuries being prevented are mostly the minor ones: lacerations (down 26%), contusions (down 36%), minor strains. The injuries that remain are harder to prevent and more expensive when they happen. A single fracture generates more lost time and higher WorkSafeBC premiums than several cut fingers.
A claim count can look good while claim costs climb. WorkSafeBC sets premiums based on claim costs, not just counts, and a smaller number of expensive injuries can push an experience rating up as fast as a larger number of cheap ones.
Hotels and restaurants are different businesses
The aggregate data hides enormous sub-sector variation. Restaurants pay a WorkSafeBC base rate of $0.58 per $100 of assessable payroll, according to the 2026 Classification & Rate List. Hotels pay $1.32. A 2.3x premium gap.
In restaurants, 65% of injuries happen in the kitchen (35% to cooks and chefs, 30% to other kitchen staff). Workers aged 15 to 24 account for 38% of all injuries, a concentration that reflects the age profile of kitchen and serving staff. The average claim generates 35 days of lost time, per the go2HR Food and Beverage Injury Profile for 2024. For a small restaurant already running tight on staffing, losing a cook for five weeks has costs well beyond the WorkSafeBC claim.
In hotels, 58% of injuries are housekeepers. Sixty percent of hotel injuries are musculoskeletal (strains, sprains, repetitive motion). The average claim generates 51 days of lost time, 46% longer than restaurants. Hotel housekeeping is one of the most physically demanding occupations in BC's service economy, and the injury data from go2HR's Accommodations Injury Profile for 2024 points the same way. The gap between restaurant and hotel claim duration matters for premium calculations: longer claims cost more, and hotel operators feel that in their experience ratings.
Both sub-sectors are classified as "low hazard" by WorkSafeBC. That classification sits uneasily alongside 5,053 time-loss claims per year.
What's left
Head injuries need separate attention. Low-hanging shelving, hard surfaces at head height, and cluttered storage areas are low-cost fixes that most operators haven't made. Walk your kitchen and storage areas at head height and mark every hard edge a falling worker could hit. For pubs and bars, violence prevention training addresses the second-biggest concussion vector.
WorkSafeBC enforcement is increasing: total penalties nearly doubled to $13.7 million in 2025. Every sustained decline in this data lines up with a fix matched to a named hazard. Falls are still waiting for theirs.
-
Duty Room analysis of accepted time-loss claims for accommodation, food, and leisure services (BCIRPU, 2001 to 2023): the 5,053 claims accepted in 2023 over 365 days is 13.8 per day, about one every 104 minutes across the full calendar, or one every 61 minutes within a 14-hour operating day.
-
1,259 back injury claims in 2001 to 655 in 2023. BCIRPU accepted time-loss claims for accommodation, food, and leisure services.
-
Implied workforce figures in the chart's data table are derived by dividing claim count by injury rate, so they are approximations, not direct headcounts. The 2009 step-change coincides with the financial crisis, but the data cannot rule out other contributing factors.
-
Rate per 100 full-time equivalent workers, from the BCIRPU accepted time-loss claims series. Denominator is WorkSafeBC's count of workers covered under the relevant classification units for accommodation, food, and leisure services.
This report is based on published enforcement data, sources available at publication, and original analysis. It is for general information only and doesn't constitute legal advice.
Safety checks that match the actual hazards
Duty Room schedules inspections around falls, burns, and MSIs. Those are the injury categories the data says matter. Evidence gets logged by site.