Same Fine, More Heat
DBPR Food-Service Enforcement: 146% Growth in Five Years
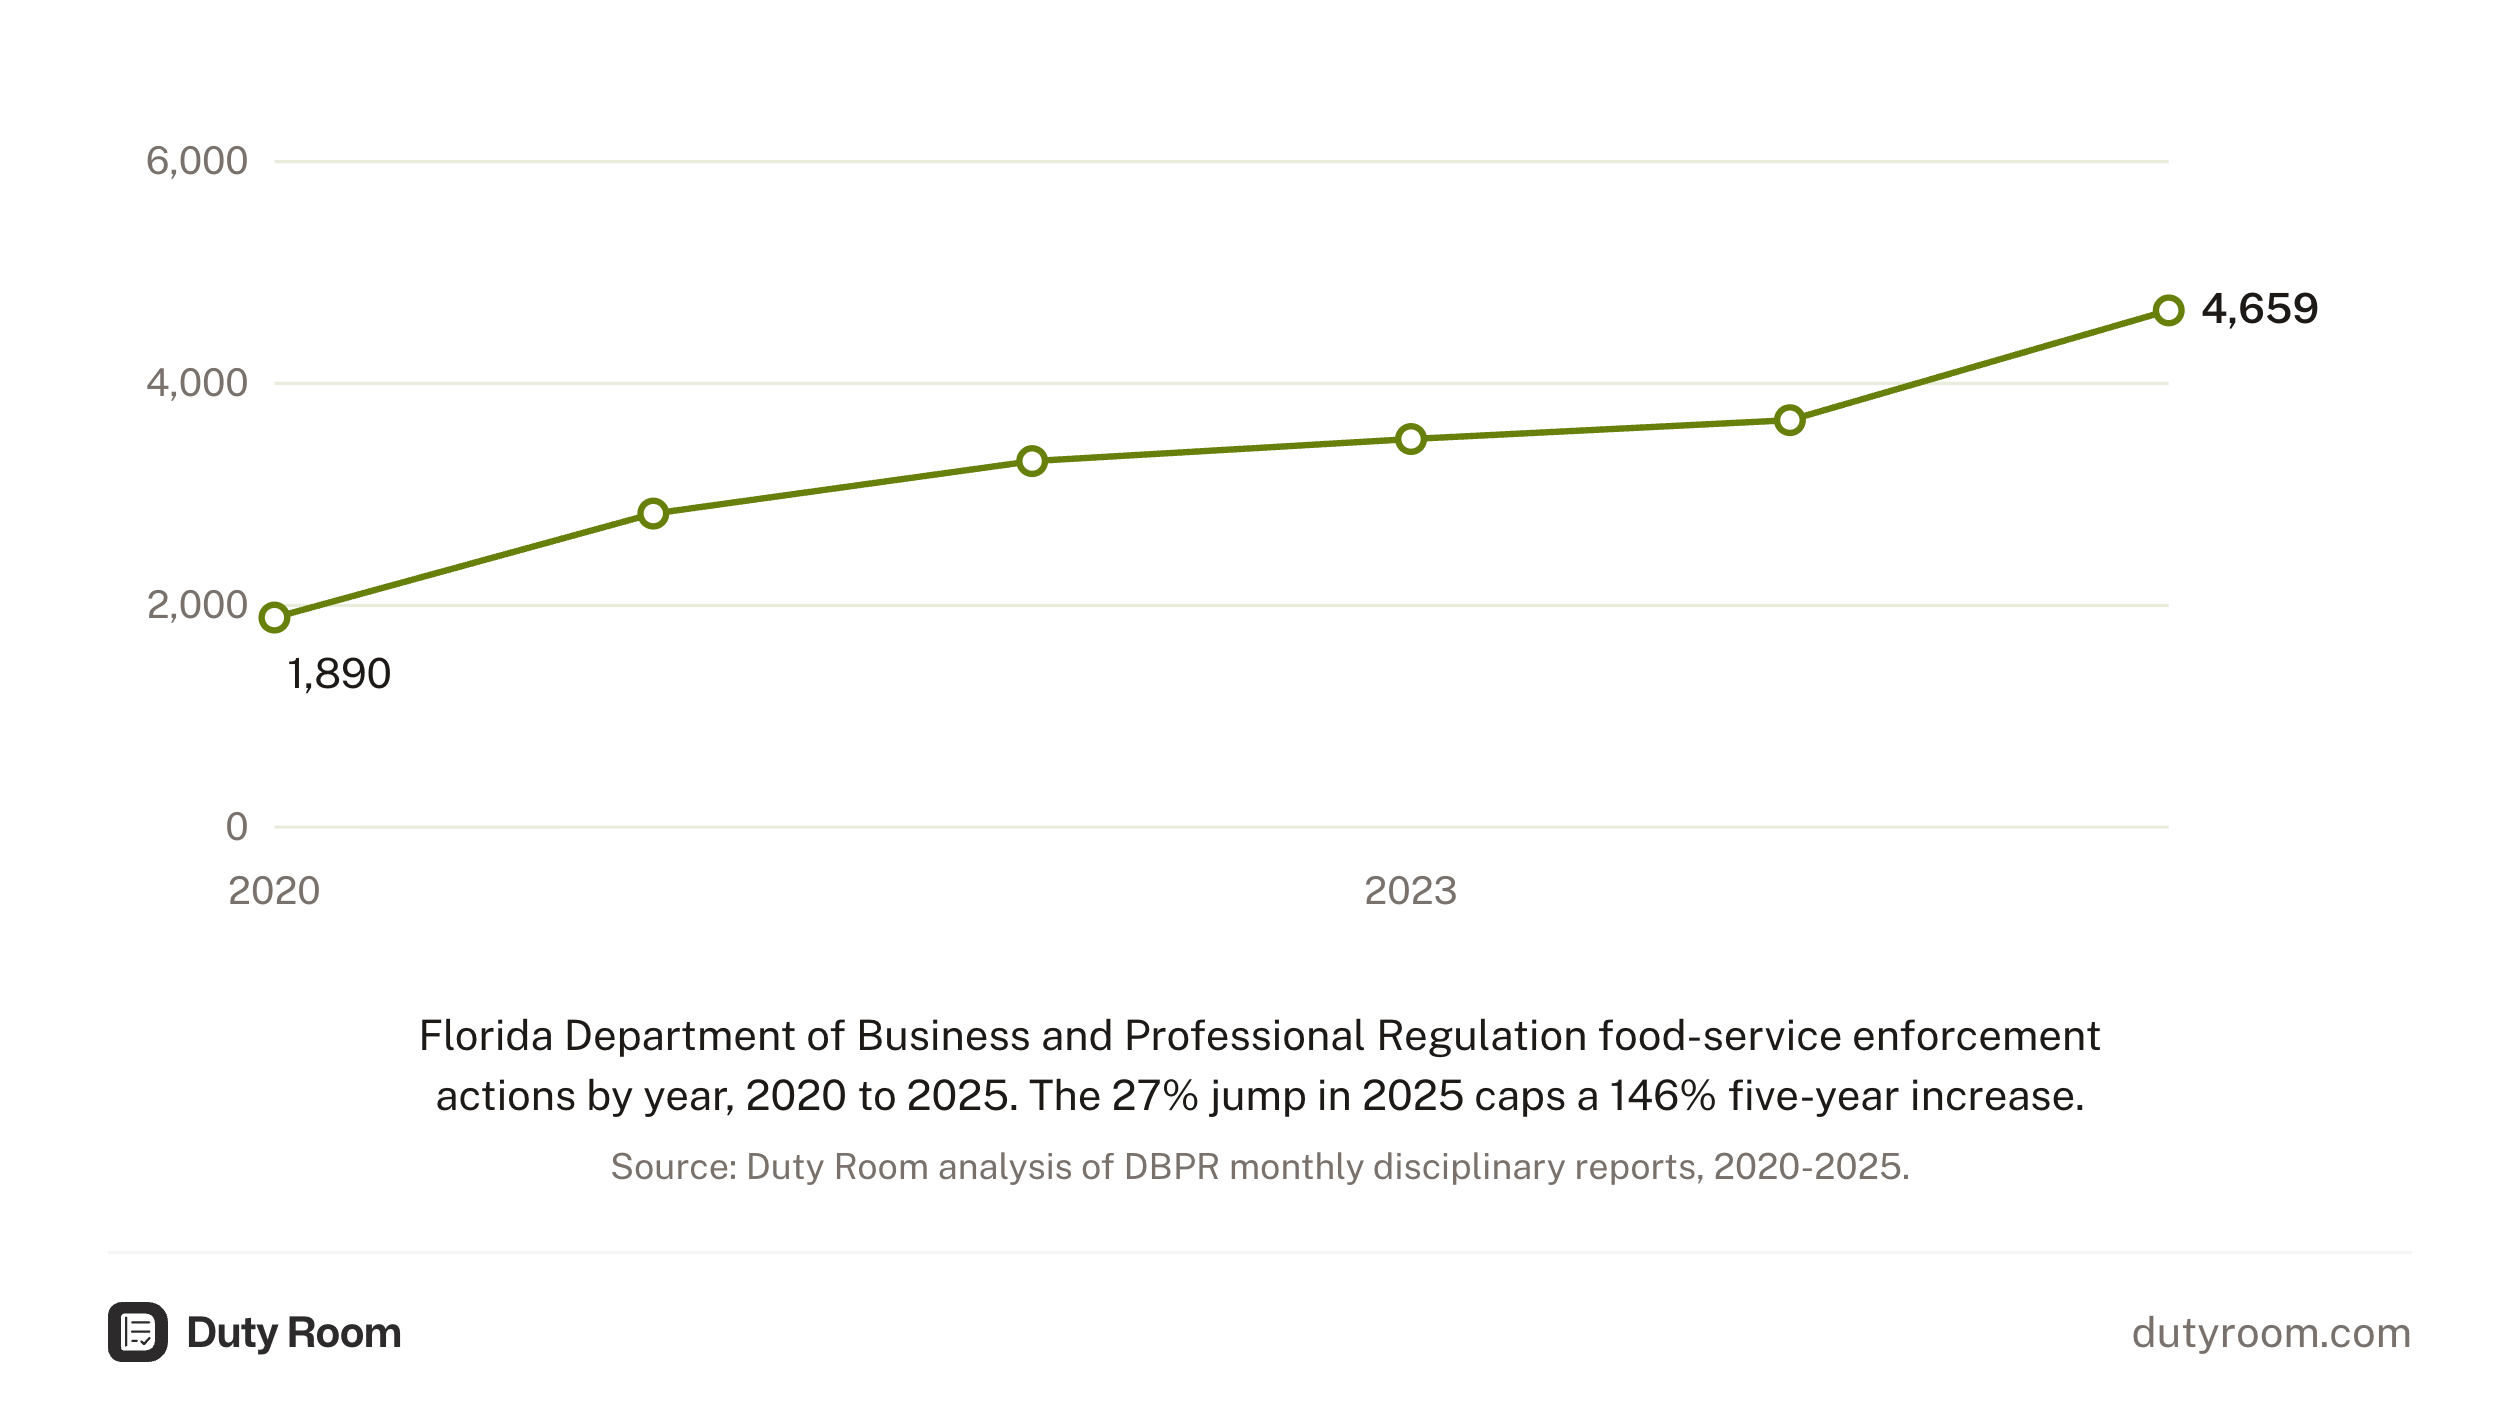
DBPR issued 4,659 disciplinary enforcement actions in 2025, up from 1,890 in 2020. That's a 146% increase in five years. The shorter operator briefing on the same trend pulls the enforcement pattern into the inspection workflow.
Total fines assessed rose from $727,710 to $1,997,450, an increase of 174%. The division assessed $7.9 million in fines across 19,847 enforcement actions from 2020 through 2025.
The median fine has barely moved. It was $400 in five of the six years since 2020, dipping to $360 in 2022. DBPR is doing more enforcement, not harsher enforcement.
All enforcement trend data in this report comes from DBPR monthly disciplinary activity reports (rdar files), January 2020 through December 2025, 72 monthly files, with repeated case numbers counted once. The February 2024 file DBPR publishes is a copy of its January 2024 file, so 2024 figures cover eleven months. Inspection and violation data comes from DBPR daily extract files covering July 2025 through March 2026, the first nine months of FY 2025-26 (112,877 food-service inspections). Establishment counts from DBPR daily CSV extracts, March 2026. Annual report figures from the DBPR Hotels & Restaurants Annual Report, FY 2024-25.
Year-by-year acceleration
| Year | Actions | YoY change | Total fines | YoY change |
|---|---|---|---|---|
| 2020 | 1,890 | $727,710 | ||
| 2021 | 2,828 | +50% | $1,069,541 | +47% |
| 2022 | 3,300 | +17% | $1,205,855 | +13% |
| 2023 | 3,500 | +6% | $1,432,085 | +19% |
| 2024 | 3,670* | +5% | $1,507,505* | +5% |
| 2025 | 4,659 | +27% | $1,997,450 | +33% |
*The 2024 row covers eleven months because the February 2024 file DBPR publishes repeats the January data. True 2024 growth is at least 5%, and the 2025 figure is measured against that eleven-month count.
The five-year compound annual growth rate is 20% for actions and 22% for fines. The 2020 count is the low point of the series. The pandemic year is the obvious explanation, though DBPR has not said so itself. Even measured from 2021, actions grew every year.
The DBPR annual report for FY 2024-25 shows 178,211 food-service and lodging inspections performed division-wide by 291 inspection staff at a 98% completion rate.
Miami is not the enforcement capital
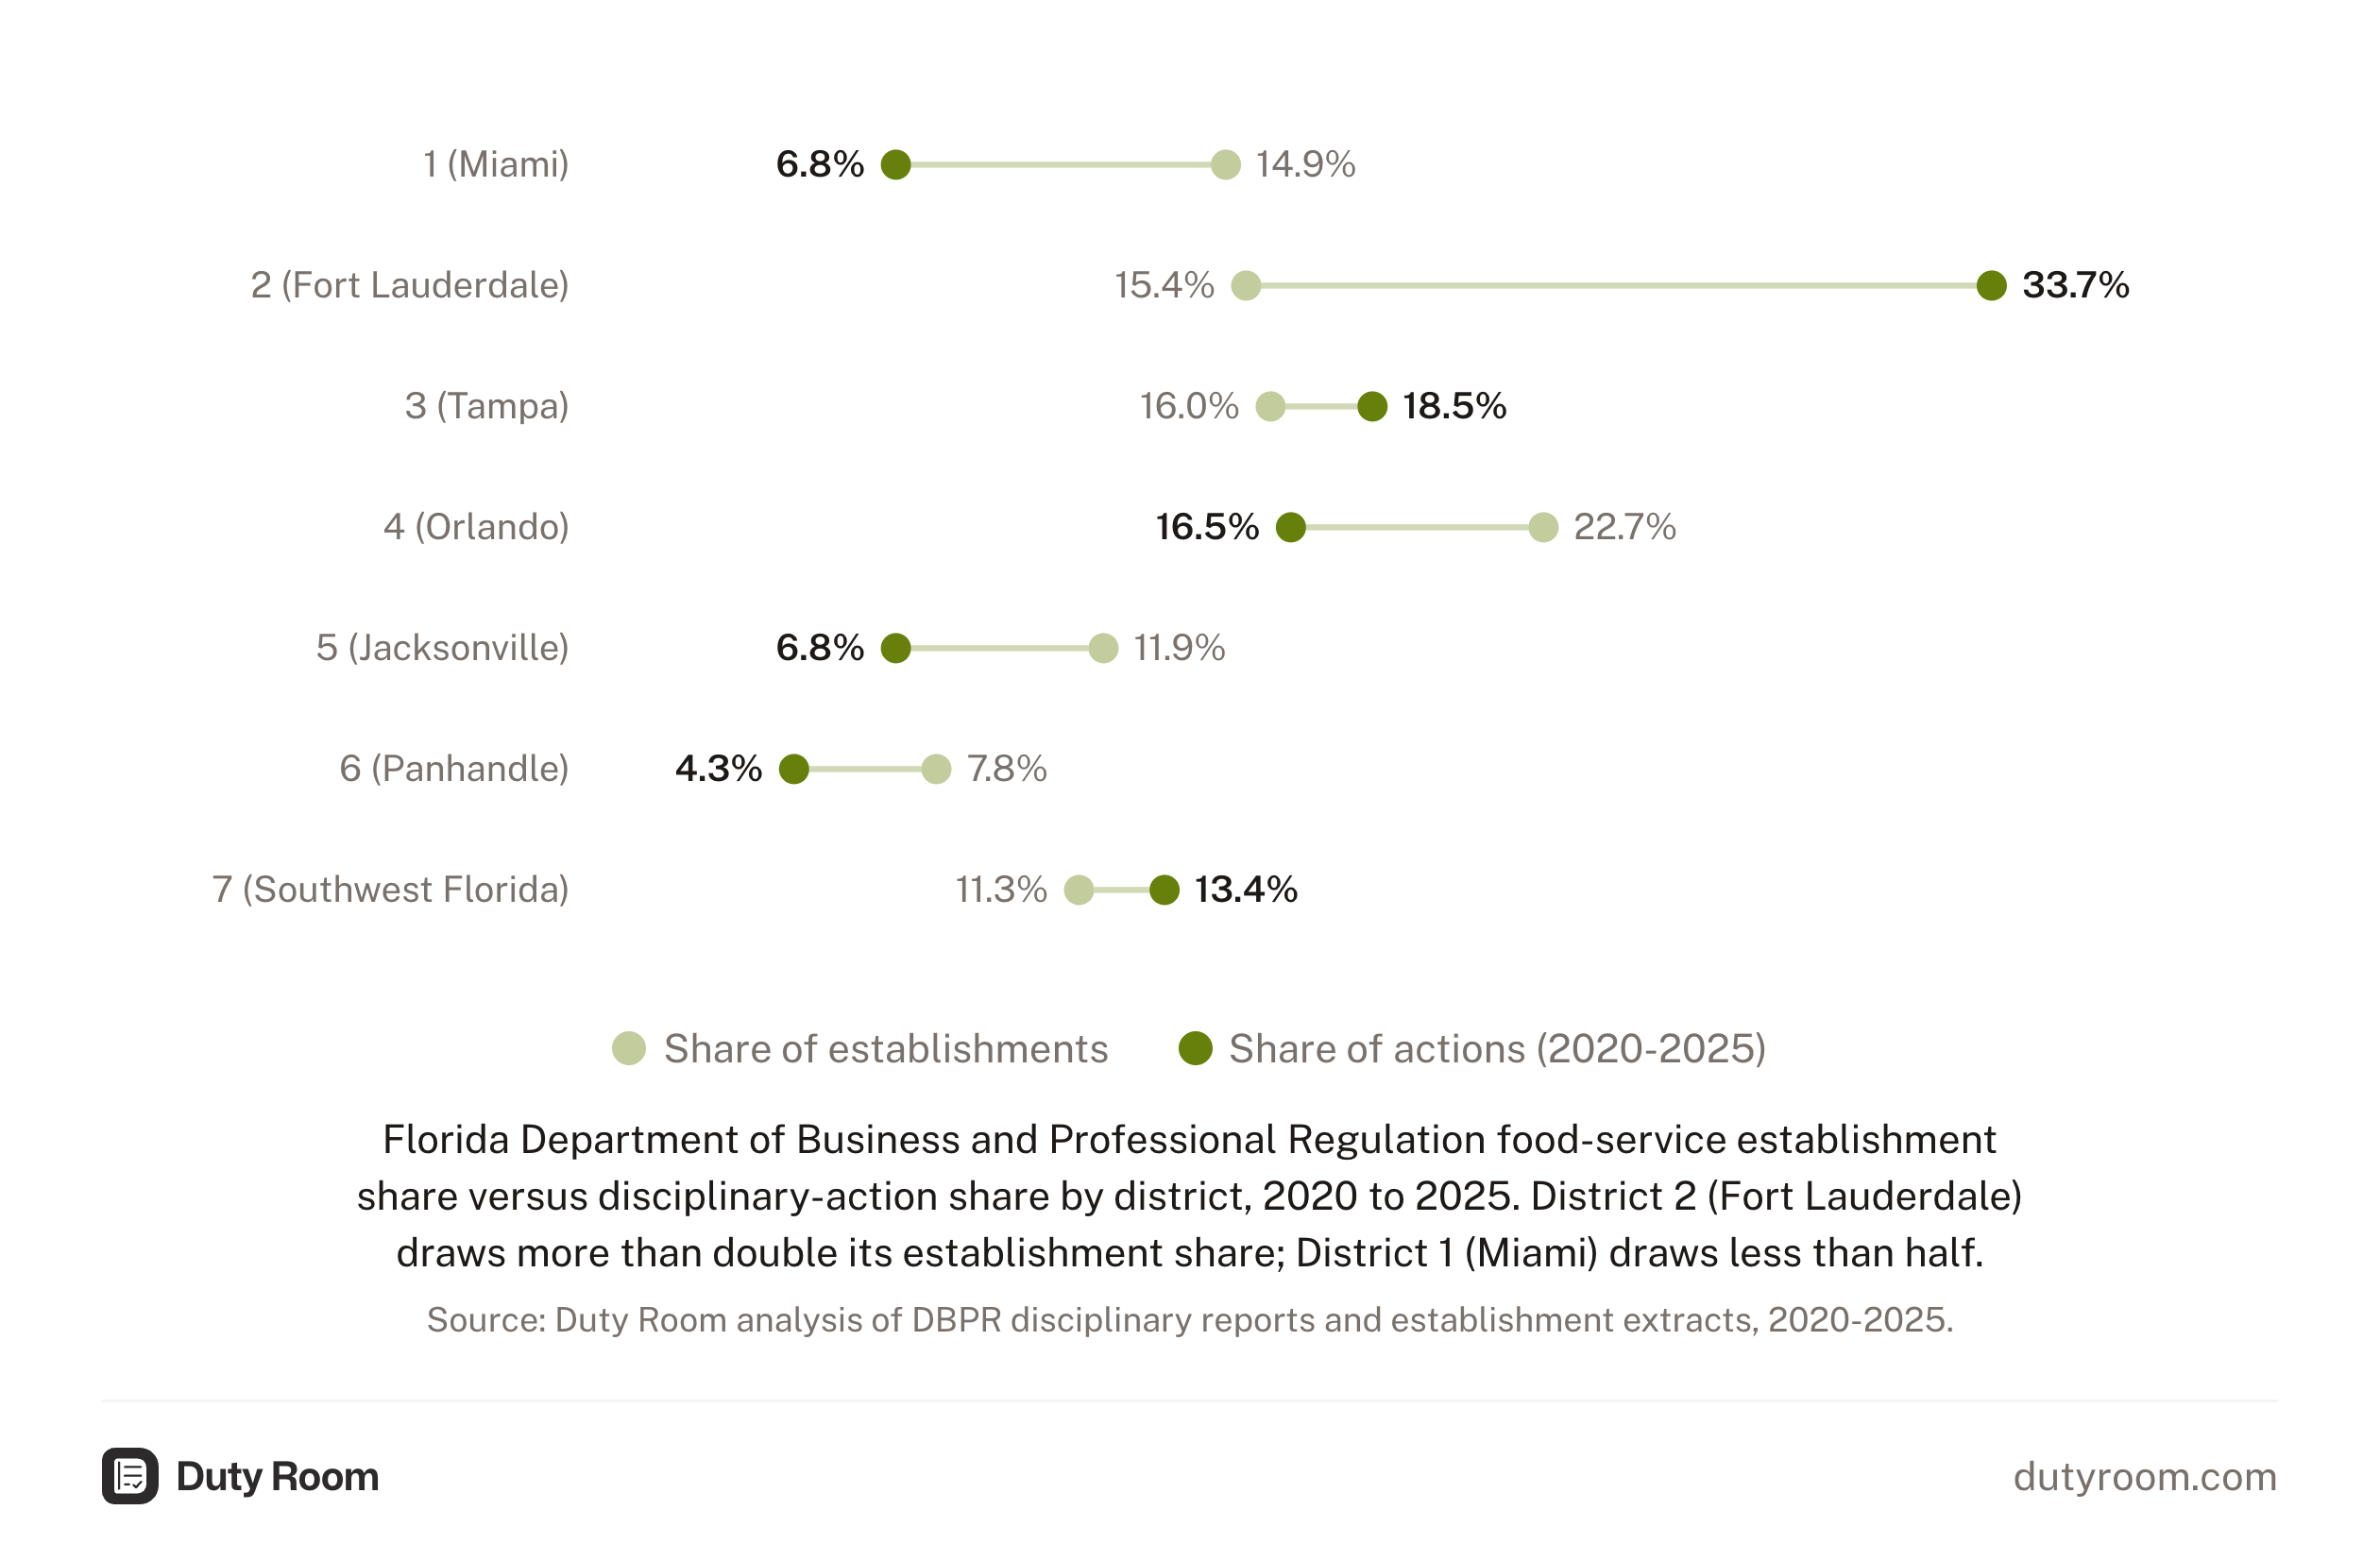
The conventional wisdom says Florida enforcement concentrates in South Florida's biggest market. The final orders say otherwise. Duty Room matched the district code carried on each of the 19,847 disciplinary cases against DBPR's establishment register, and District 1, which covers Miami-Dade and Monroe counties, turns out to be the lightest-enforced part of the state relative to its size: it holds 14.9% of Florida's food-service establishments and produced 6.8% of enforcement actions across the six years. Its share has fallen from 12% of all actions in 2020 to under 5% in 2025.
The district that leads is District 2, covering Broward, Palm Beach and Martin counties. It holds 15.4% of establishments and produced 33.7% of enforcement actions, more than double its establishment share, and its share has grown from 26% of all actions in 2020 to 43% in 2025.
| District | Share of establishments | Share of actions (2020-2025) |
|---|---|---|
| 1 (Miami: Dade, Monroe) | 14.9% | 6.8% |
| 2 (Fort Lauderdale: Broward, Palm Beach, Martin) | 15.4% | 33.7% |
| 3 (Tampa) | 16.0% | 18.5% |
| 4 (Orlando) | 22.7% | 16.5% |
| 5 (Jacksonville) | 11.9% | 6.8% |
| 6 (Panhandle) | 7.8% | 4.3% |
| 7 (Southwest Florida) | 11.3% | 13.4% |
The county table below shows the same South Florida split: Palm Beach and Broward post two of the highest action rates per establishment, while Dade posts one of the lowest.
County-level variation
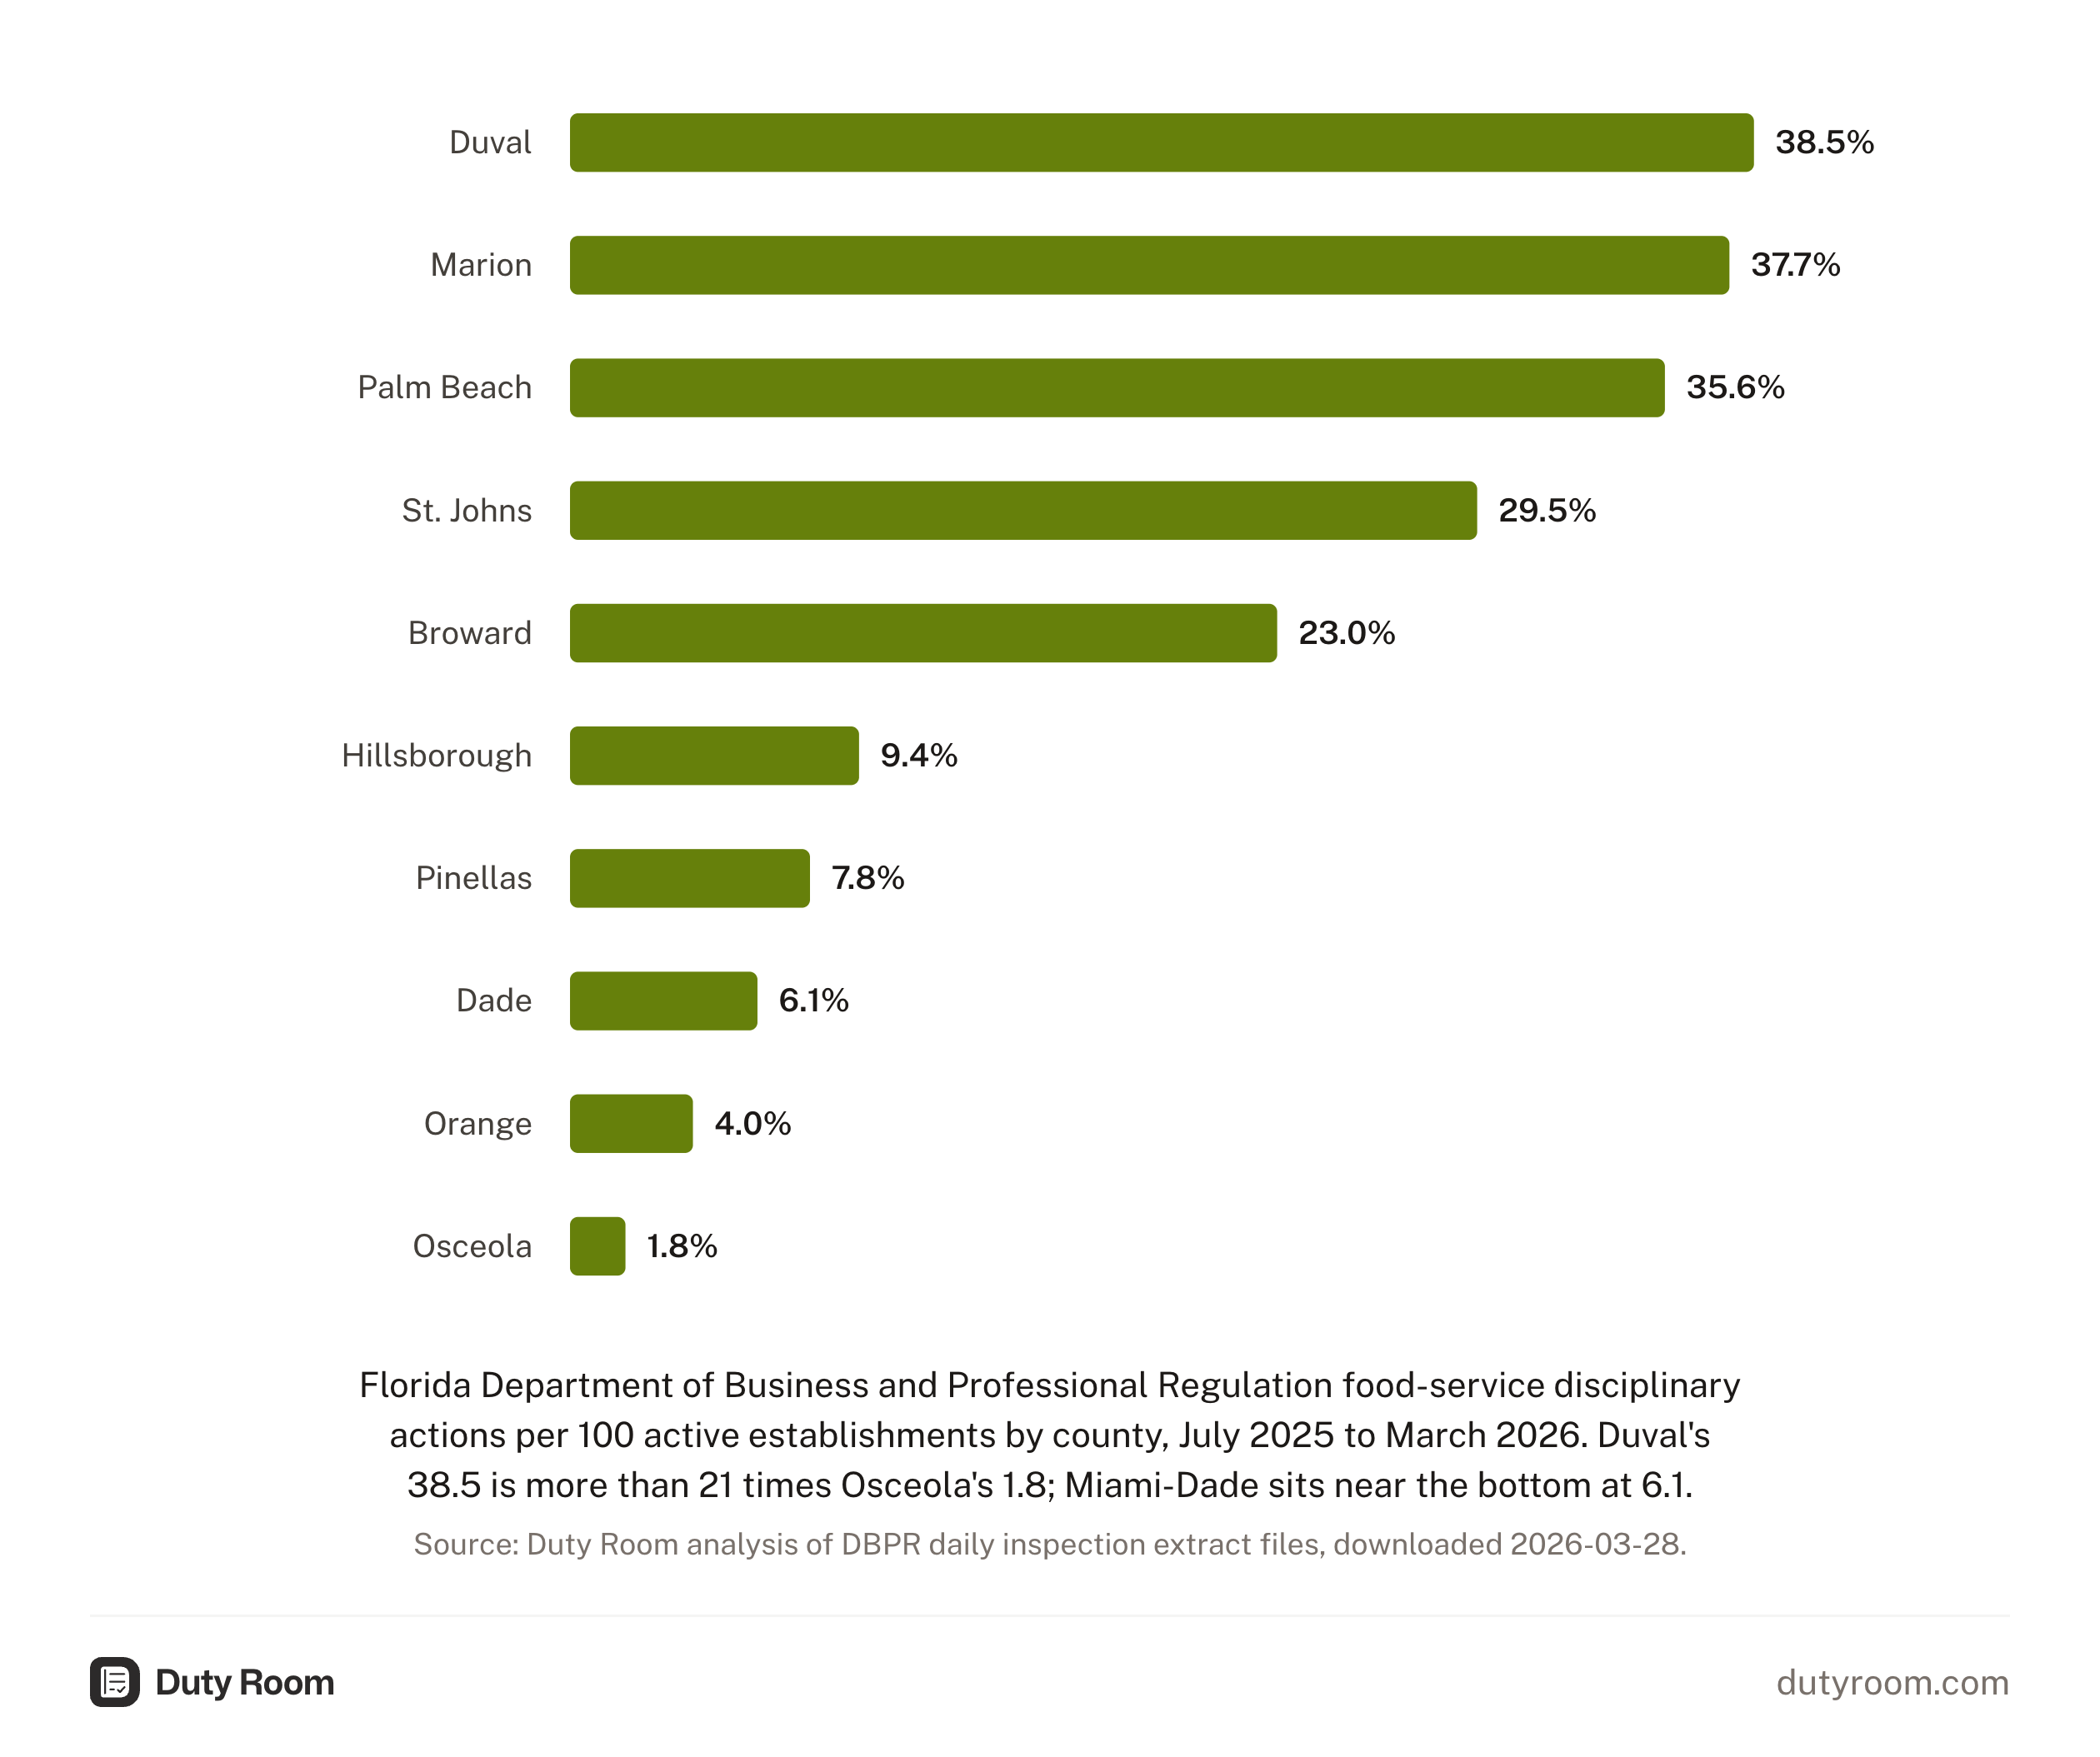
District-level data hides the county story. Cross-referencing establishment counts against inspection outcomes shows enforcement action intensity varying by a factor of 21 within the same state.
The table below shows actions per active establishment: formal enforcement actions (emergency orders plus administrative complaints) divided by active establishments in each county, over the same July 2025 to March 2026 extract. This is an action count, not a unique-establishment count. An establishment cited twice in one year counts twice in the numerator.
| County | Establishments | Actions per active establishment |
|---|---|---|
| Duval (Jacksonville) | 3,217 | 38.5% |
| Marion (Ocala) | 972 | 37.7% |
| Palm Beach | 4,057 | 35.6% |
| St. Johns (St. Augustine) | 982 | 29.5% |
| Broward (Ft. Lauderdale) | 5,358 | 23.0% |
| Hillsborough (Tampa) | 3,964 | 9.4% |
| Pinellas (St. Petersburg) | 2,822 | 7.8% |
| Dade (Miami) | 8,936 | 6.1% |
| Orange (Orlando) | 6,264 | 4.0% |
| Osceola (Kissimmee) | 1,350 | 1.8% |
Duval County recorded enforcement actions equal to 38.5% of its active establishment count. That's 6x the intensity in Miami-Dade (6.1%), despite Dade having nearly three times the establishments. The action rate in Duval is more than 21x the rate in Osceola.
Orlando has the lowest action intensity among major metros at 4.0% and the lowest inspections-per-establishment ratio (1.4).
Callback escalation
When an inspector finds violations that have to be corrected, a callback inspection follows. Of 20,139 callbacks in the nine months from July 2025 through March 2026:
| Outcome | Count | Share |
|---|---|---|
| Complied | 14,563 | 72.3% |
| Escalated to enforcement | 3,218 | 16.0% |
| Extension given | 2,358 | 11.7% |
One callback in six escalated: the inspector recommended an administrative complaint, or an emergency-order callback found the problem uncorrected.
Repeat offenses
The DBPR annual report for FY 2024-25 breaks down food-service enforcement cases by offender status:
| Category | Cases | Share |
|---|---|---|
| 1st offense | 3,316 | 69% |
| 2nd offense | 1,009 | 21% |
| 3rd offense | 333 | 7% |
| 4th or higher | 158 | 3% |
31% of food-service enforcement cases were repeat offenses. 10% were third offense or higher. Three disciplinary final orders within the previous two annual inspection cycles move an establishment to Risk Level 3 (three inspections per year instead of two).
DBPR collected 94% of fines assessed ($1,640,257 of $1,743,570 in food-service fines) in FY 2024-25. 75% of all fines are $500 or less. The maximum on record is $6,000. The statutory cap is $1,000 per offense under s. 509.261. The emergency-closure pattern is broken out in our Florida shutdown briefing.
| Fine | Establishment | City |
|---|---|---|
| $6,000 | La Granja Restaurant | West Palm Beach |
| $4,500 | TooJay's Deli | Wellington |
| $3,500 | Mr Han Restaurant | Gainesville |
| $3,000 | Yakitori Sake House | Boca Raton |
| $3,000 | La Granja Restaurant | Lake Worth |
| $2,750 | Stoner's Pizza Joint | Daytona Beach |
Operator compliance scorecard
Rejoining the archived March 2026 establishment and inspection extracts at the license level across 30 multi-site operators with 10 or more Florida locations still produces a wide compliance spread. The table below is a licensee-level view of DBPR public records, not a brandwide regulator scorecard.
Lowest violation rates
| Operator | Sites | HP violations/inspection | Clean rate |
|---|---|---|---|
| Mini Melts of America | 152 | 0.00 | 100% |
| Levy Premium Foodservice | 102 | 0.01 | 100% |
| Orlando Foodservice Partners | 67 | 0.03 | 100% |
| Walt Disney Parks and Resorts | 149 | 0.03 | 99% |
| CFL Pizza | 85 | 0.22 | 86% |
Highest violation rates
| Operator | Sites | HP violations/inspection | Clean rate |
|---|---|---|---|
| Sunshine Restaurant Merger Sub | 112 | 1.21 | 62% |
| East Coast Waffles | 86 | 1.13 | 59% |
| Carrabba's Italian Grill | 60 | 1.12 | 50% |
| Cracker Barrel Old Country Store | 60 | 1.07 | 67% |
| Outback Steakhouse of Florida | 96 | 0.97 | 62% |
Disney has 149 active food locations in the archived March extract and passed clean on 99% of matched inspections. East Coast Waffles, a wholly owned Waffle House subsidiary with 86 active locations, passed clean on 59% of matched inspections.
In this 30-operator sample (selected as the largest licensees by Florida site count with 10+ locations and at least 60 matched inspections in the July 2025 to March 2026 extract), standardized quick-service, concession and kiosk operators cluster near the low-HP end, while full-service licensees account for most high-HP rows. The sample is too small to generalize from, but the gap within it is wide. "Clean rate" is the percentage of inspections resulting in no further action. "HP violations/inspection" is High Priority violations divided by total inspections for that licensee.
Violations by frequency
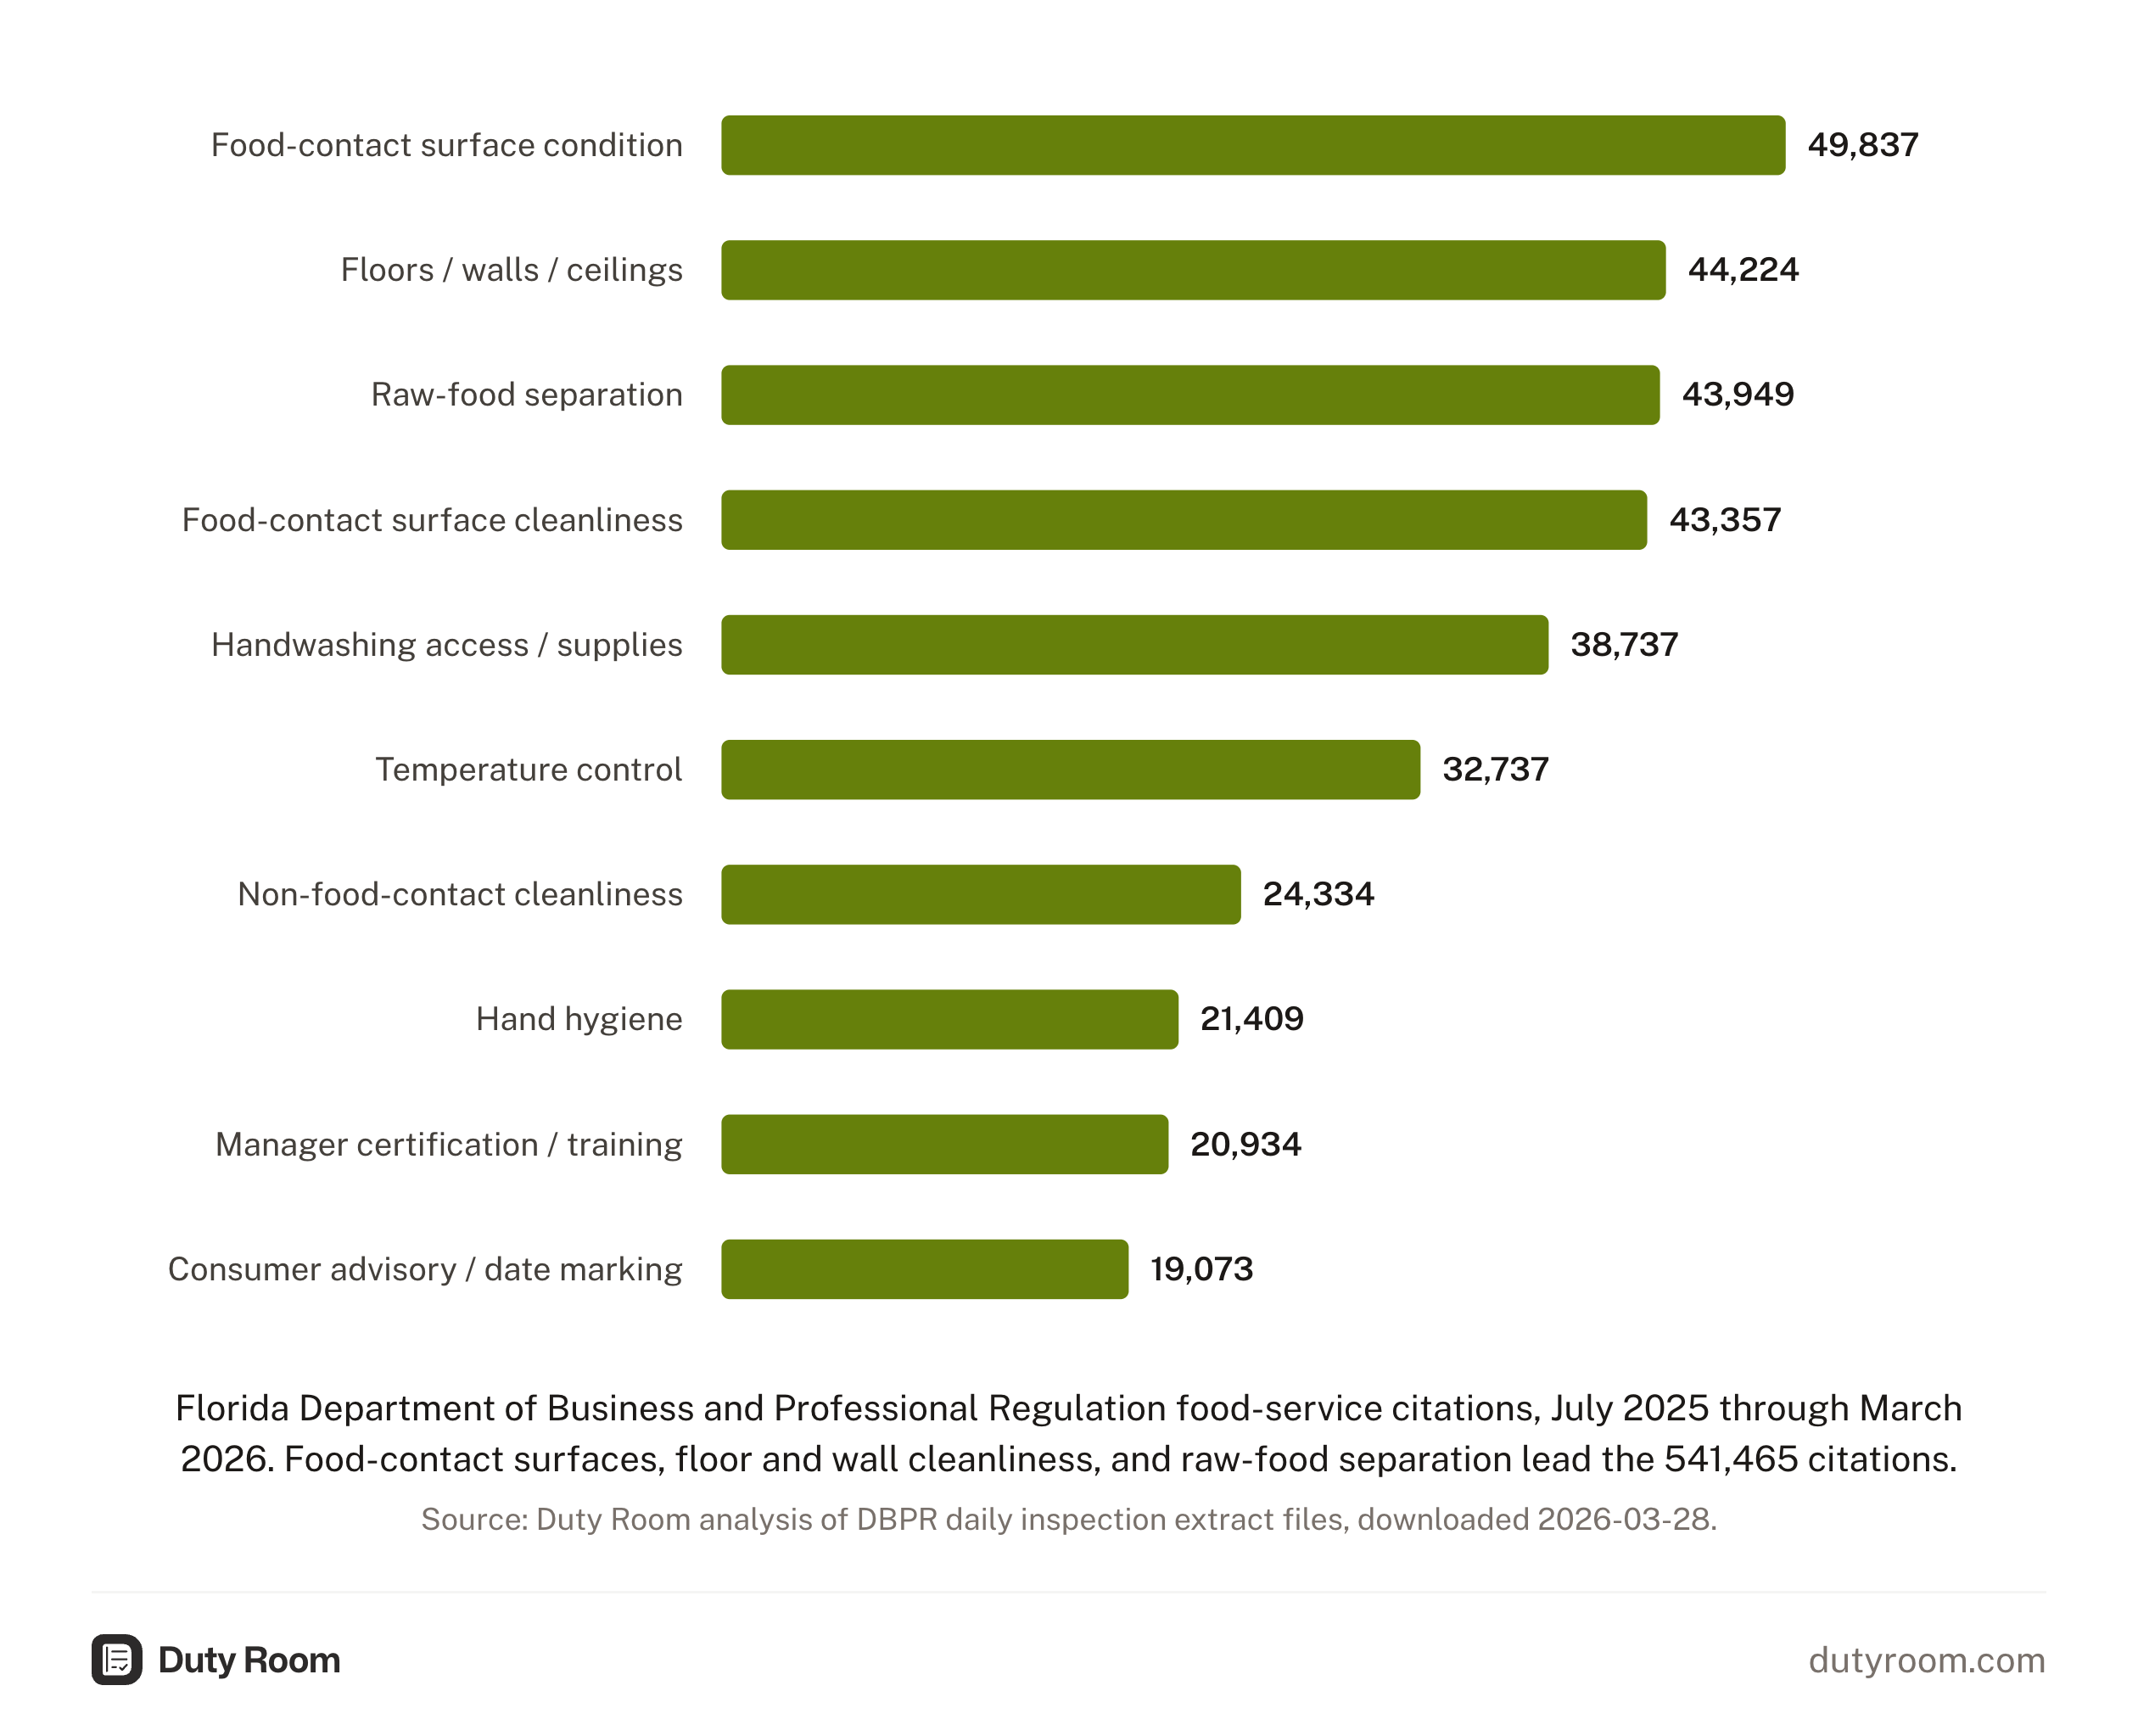
541,465 violations cited across 112,877 food-service inspections, July 2025 through March 2026:
| Rank | Violation | Citations | Priority |
|---|---|---|---|
| 1 | Food-contact surfaces: design, condition, maintenance | 49,837 | Intermediate |
| 2 | Floors, walls, ceilings: construction and cleanliness | 44,224 | Basic |
| 3 | Separating raw animal foods; food protection | 43,949 | High |
| 4 | Food-contact surface cleanliness | 43,357 | Intermediate |
| 5 | Handwashing facilities: access, supplies | 38,737 | High |
| 6 | Temperature control: cooking, cooling, reheating, holding | 32,737 | High |
| 7 | Non-food-contact surface cleanliness | 24,334 | Basic |
| 8 | Hand hygiene; eating, drinking, smoking | 21,409 | High |
| 9 | Food manager certification; employee training | 20,934 | High |
| 10 | Consumer advisory; date marking; labeling | 19,073 | High |
The most cited violation (food-contact surface condition, 49,837) is Intermediate priority. The third most cited (raw food separation, 43,949) and fifth (handwashing facilities, 38,737) are High Priority.
Seasonal patterns
Inspection counts cover July 2025 through March 27, 2026; April through June are outside the extract.
| Month | Inspections | Emergency closures |
|---|---|---|
| October | 15,030 (peak) | 151 |
| September | 14,213 | 155 |
| July | 13,492 | 166 (peak closures) |
| August | 13,296 | 145 |
| March | 12,697 | 108 |
| January | 11,644 | 89 |
| December | 11,525 | 114 |
| February | 11,454 | 95 |
| November | 9,525 (lowest) | 77 (lowest) |
99.4% of inspections happen Monday through Friday. Tuesday and Wednesday are the busiest days (22% each). Friday is 20% lighter than mid-week.
Market context
The archived March 2026 DBPR establishment extract contained 64,996 active establishment records, of which 51,866 were permanent seated restaurants. In that extract, 664 multi-site operators (5 or more locations) controlled 10,276 sites, 15.8% of the total.
13.2% of all establishments either opened new or changed ownership in the current fiscal year (8,568 sites). Each enters the DBPR system with fresh compliance clocks: 30 days for food manager certification under F.S. 509.039, 60 days for employee training under F.S. 509.049. Our Florida food safety resources cover the recurring records behind those clocks.
The five-year trend line has not flattened. Enforcement actions have grown every year since 2020.
This report is based on published enforcement data, sources available at publication, and original analysis. It is for general information only and doesn't constitute legal advice.
The records the inspector looks for, per site
Florida operators keep temperature logs, Food Manager certifications, and cleaning records current for DBPR inspections. Duty Room organizes the evidence and shares it across every site.